
樂
樂觀
樂觀 · 25%RUN
$7.80
情境價格
$7.570
+0.747 (+9.87%)收盤時
Sunrun Inc. is a provider of clean energy as a subscription service. It is engaged in the design, development, installation, sale, ownership and maintenance of residential solar energy systems (Projects) in the United States. It provides clean, solar energy typically at savings compared to traditional utility energy. Its primary customers are residential homeowners. It also offers battery storage along with solar energy systems to its customers in select markets and sells its services to certain commercial developers through its multifamily and new homes offerings. It installs solar energy systems on its customers' homes and provides them with the solar power produced by those systems for typically a 20- or 25-year initial term. It monitors, maintains and insures the system during the term of the contract. It also provides electric vehicle (EV) chargers, battery retrofits, re-powered or expanding systems, home energy management services, and other home electrification products.
Sunrun Inc is currently not a strong buy due to its low RSI of 36.95, indicating it is nearing oversold territory, and a significant year-to-date change of -62.45%. However, the company has shown improvement in gross margin, which reached 37.73% in Q2 2026, and analysts have set a price target range between $11 and $14, suggesting potential upside from the current price of $7.30. The main risk is the negative sentiment reflected in the recent 5-day change of -4.45% and the overall market conditions, as indicated by the SPY's 5-day performance of -1.97%.
Citi
$14
2026-10-09
Citi
2026-10-09
目標價
$14
Barclays
$12
2026-10-09
Barclays
2026-10-09
目標價
$12
Goldman Sachs
$11
2026-10-08
Goldman Sachs
2026-10-08
目標價
$11
Goldman Sachs
$13
2026-09-21
Goldman Sachs
2026-09-21
目標價
$13
Citi
$16
2026-08-07
Citi
2026-08-07
目標價
$16
情境價格取自當年最後一個月度預測區間。機率為固定的模型權重(25 / 50 / 25),不構成保證。
Household Batteries Power California Grid Amid Heat Wave
Google Partners with PG&E on Smart Home Energy Project

Sunrun Q2 2026 Earnings Call Insights
Sunrun Prices $267M Asset-Backed Securitization for Solar Leases

Sunrun Prices $267 Million Securitization of Solar Assets
Sunrun Inc. is a provider of clean energy as a subscription service. It is engaged in the design, development, installation, sale, ownership and maintenance of residential solar energy systems (Projects) in the United States. It provides clean, solar energy typically at savings compared to traditional utility energy. Its primary customers are residential homeowners. It also offers battery storage along with solar energy systems to its customers in select markets and sells its services to certain commercial developers through its multifamily and new homes offerings. It installs solar energy systems on its customers' homes and provides them with the solar power produced by those systems for typically a 20- or 25-year initial term. It monitors, maintains and insures the system during the term of the contract. It also provides electric vehicle (EV) chargers, battery retrofits, re-powered or expanding systems, home energy management services, and other home electrification products. It operates in the Energy sector (MISCELLANEOUS ELECTRICAL MACHINERY, EQUIPMENT & SU industry).
Sunrun Inc is currently not a strong buy due to its low RSI of 36.95, indicating it is nearing oversold territory, and a significant year-to-date change of -62.45%. However, the company has shown improvement in gross margin, which reached 37.73% in Q2 2026, and analysts have set a price target range between $11 and $14, suggesting potential upside from the current price of $7.30. The main risk is the negative sentiment reflected in the recent 5-day change of -4.45% and the overall market conditions, as indicated by the SPY's 5-day performance of -1.97%.
7 analysts cover RUN: 6 rate it Buy, 1 Hold and 0 Sell. The average price target is 23.53.

Watch this $RUN setup for an upside breakout from this wedge in the near future. Solar names are at nice discounts.
展開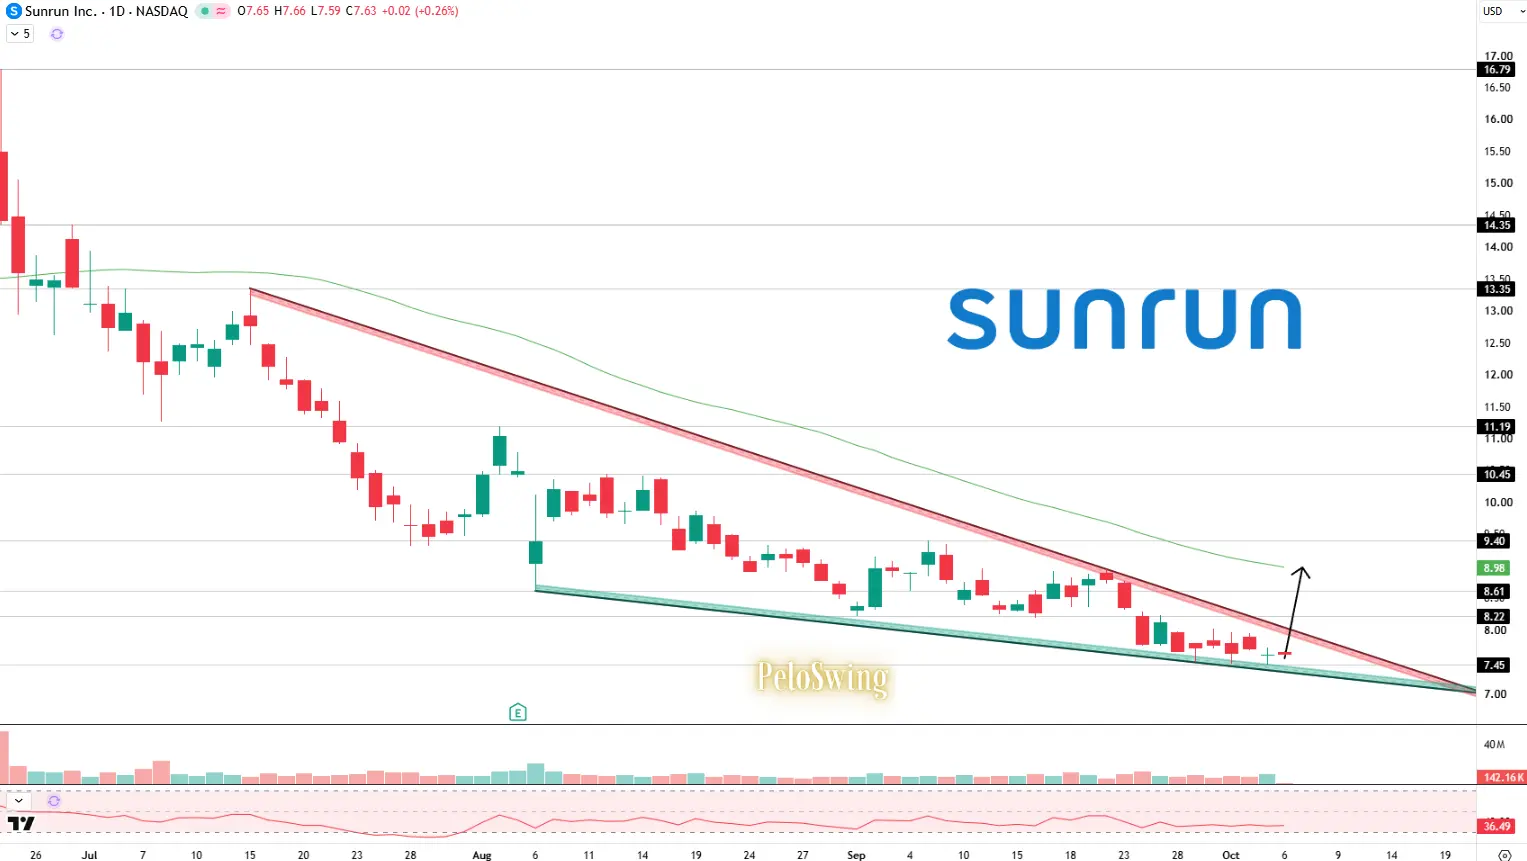
本頁僅供研究參考,不構成投資建議。模型可能出錯。過往表現不代表未來結果。