
M
Maplelane Capital, LLC
+ 持有QNT
+2.97%
3個月報酬率
$36.680
+4.053 (+11.05%)收盤時
Quantinuum Inc. is a provider of quantum computing platform, which offers solutions like hardware platforms, developer tools, application libraries and solution-targeted intellectual property. The Company's vertically integrated quantum computing platform combines quantum hardware systems and middleware with application software designed to make quantum computing deployable in real-world environments built on the Quantum Charge‑Coupled Device architecture. Its products and solutions include Quantinuum Systems, Helios, Quantum Origin, InQuanto and Nexus. Nexus is a quantum computing platform for accessing and managing performance full stack. InQuanto is a quantum computational chemistry for complex molecular and materials simulations. Quantum Origin is a quantum random number generator designed for encryption and protect data. Its developer tools include TKET, Guppy and Lambeq. It operates across pharmaceuticals, materials science, financial services, government and industrial markets.
Quantinuum Inc. (QNT) is not a good buy right now due to its current price of $41.30, a significant drop of 31.17% year-to-date, and a very low RSI of 7.597 indicating oversold conditions. The company has reported substantial losses, with a net income of -596520000 USD in Q2 2026, and a gross margin of -81.26%. The main risk is its high price-to-sales ratio of 480.17, suggesting that the stock may be overvalued compared to its revenue generation.
Morgan Stanley Upgrades Quantinuum to Overweight with $62 Target Price
Morgan Stanley Sees Quantum Computing Market Exceeding $100 Billion by 2040

Latest Wall Street Rating Updates

Top Crypto Winners of 2026 Revealed

Emerging Investment Opportunities in Quantum Computing
Quantinuum Inc. is a provider of quantum computing platform, which offers solutions like hardware platforms, developer tools, application libraries and solution-targeted intellectual property. The Company's vertically integrated quantum computing platform combines quantum hardware systems and middleware with application software designed to make quantum computing deployable in real-world environments built on the Quantum Charge‑Coupled Device architecture. Its products and solutions include Quantinuum Systems, Helios, Quantum Origin, InQuanto and Nexus. Nexus is a quantum computing platform for accessing and managing performance full stack. InQuanto is a quantum computational chemistry for complex molecular and materials simulations. Quantum Origin is a quantum random number generator designed for encryption and protect data. Its developer tools include TKET, Guppy and Lambeq. It operates across pharmaceuticals, materials science, financial services, government and industrial markets. It operates in the Technology sector.
Quantinuum Inc. (QNT) is not a good buy right now due to its current price of $41.30, a significant drop of 31.17% year-to-date, and a very low RSI of 7.597 indicating oversold conditions. The company has reported substantial losses, with a net income of -596520000 USD in Q2 2026, and a gross margin of -81.26%. The main risk is its high price-to-sales ratio of 480.17, suggesting that the stock may be overvalued compared to its revenue generation.

$QNT opened another large short position — and it paid off afterward. Entry: 235 - 286 Stop loss: 293 Take profit: 233 Take profit: 178 Take profit: 76 Technical indicators are severely overbought: the hourly RSI reached an extreme value of 94.9 and remains above 85; price is approaching the upper Bollinger Band → indicating the market is severely overbought, and the likelihood of short-term profit-taking is high.
展開

$TRUTH short setup is forming. TRUTH has moved up sharply from around $0.014 to around $0.024 and is now consolidating near $0.0224. If sellers take control, price may pull back further. Short entry: $0.0222 to $0.0225. TP1: $0.0210. TP2: $0.0190. TP3: $0.0170. Stop loss: $0.0260. Wait for bearish confirmation before entering. After such a sharp rise, volatility is high, so manage risk carefully. Sell and trade $WA $QNT.
展開

$QNT's direction isn't that unclear. The real question is whether the current position is still worth holding for direction. I'm only watching one disagreement: whether there's still follow-through after a break above 222.82. Current price is 205.88, volume at 1.01x. The 1-hour is weak, the 4-hour is weak, with RSI at 32 and 34 respectively. If volume continues to expand after a break above 222.82, the initiative leans toward the bulls; if it breaks below 202.17 and fails to reclaim it, the short-term read is invalidated, and the next level to watch shifts to 200.71. Don't rush to guess the endpoint. First see which condition plays out. Between a same-direction structure and limited room, which one would you put first? The above is market observation and does not constitute investment advice. This is Niu Niu Shuo in the crypto space.
展開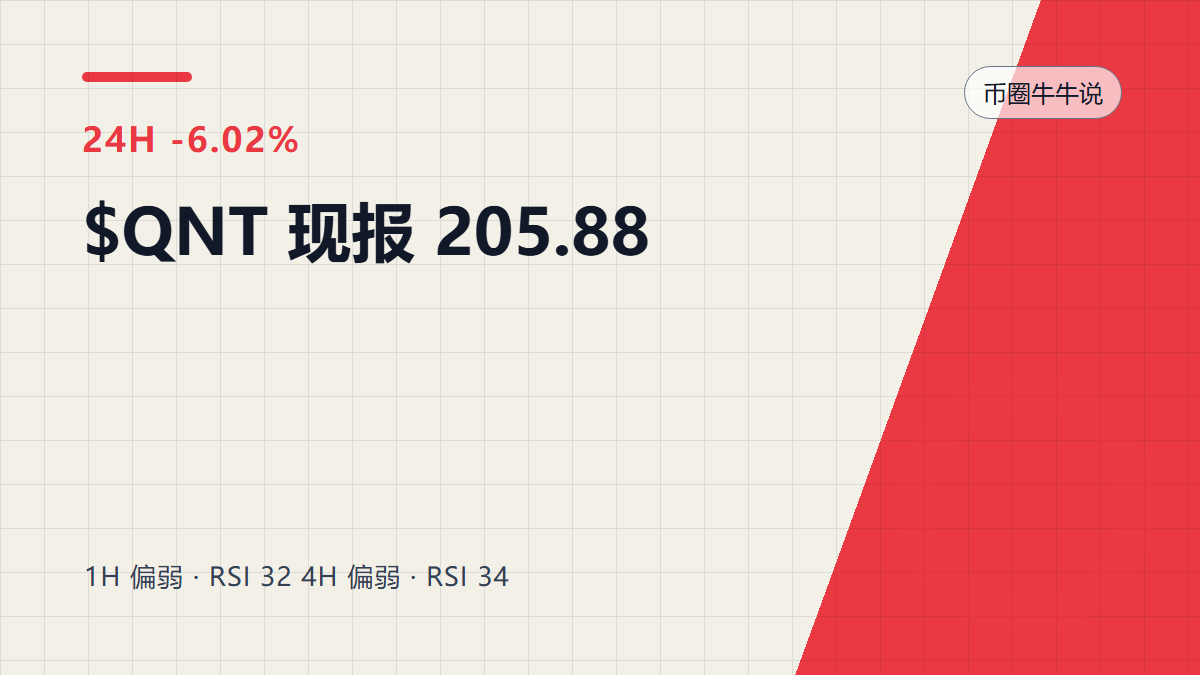
$S is at 0.05721. On the short-term chart, the key levels are MA5 at 0.05687 and MA20 at 0.05940. Price is squeezed between them, and the moving averages are in a bearish alignment, which suggests weak consolidation rather than a healthy uptrend. Here is a reusable way to read the chart: use the MA5 and MA20 alignment to judge trend health. A healthy bullish structure requires MA5 to cross above MA20 and stay above it, with pullbacks holding. For $S right now, MA5 = 0.056874 is below MA20 = 0.059399, a typical bearish alignment, so the trend has not repaired yet. RSI = 46.9 is in the neutral-to-weak zone, with no oversold rebound momentum. The MACD histogram is -0.0005566, still below the zero line, so bearish momentum has not faded. The only bullish signal is the funding rate at -0.0050%, meaning shorts pay, which shows crowded short positioning and the possibility of a short squeeze rebound, but that is a tactical opportunity, not a trend opportunity. The Bollinger Bands [0.0501236, 0.0686744] are extremely wide, with about 37.79% amplitude over 30 candles, so volatility is high and position size must be kept light. Directional view: short-term bias is bearish, but only short rebounds or wait for the moving averages to repair before turning long. Entry reference: 0.0585–0.0594, shorting near MA20 resistance. Take-profit 1: 0.0550, the prior low support zone. Take-profit 2: 0.0510, near the lower Bollinger Band. Stop-loss: 0.0615; if price effectively holds above MA20, the bearish logic is invalidated. If price holds MA20 with volume, switch to watching. Also watch: $ET and $QNT. ETH funding rate has turned positive and MACD is bullish, making it relatively stronger than $S. QNT is down 5.88% in 24h but MACD is still bullish, making it an oversold name, with clear strength divergence. (Personal view only, for reference only, not investment advice. Futures risk is extremely high, please strictly control position size.) Data: Pair: SUSDT Direction: Short Entry: 0.0585-0.0594 Take-profit 1: 0.0550 Take-profit 2: 0.0510 Stop-loss: 0.0615
展開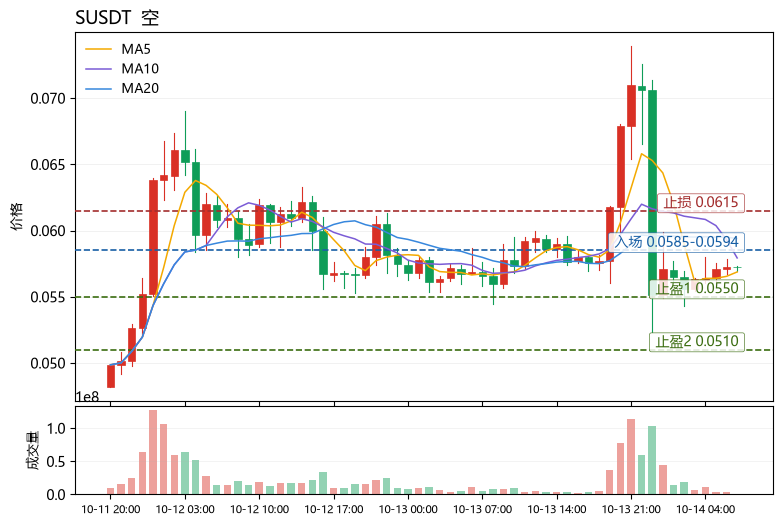
$QNT has entered oversold territory, but "it should bounce" and "it has bottomed" are not the same thing. This time, I am not looking at gainers and losers lists, only at position. The current price is 212.92, about 5.73% from the 1-hour support at 200.71, and about 8.81% from resistance at 231.67. My condition is simple: only a breakout above 231.67 that continues counts as upside follow-through; if it falls below 200.71, the original view is invalid. The 1-hour is weak, the 4-hour is weak, and RSI is 36 and 30 respectively. What is being debated now is not a directional slogan, but whether there is still follow-through demand after a breakout above 231.67. Is this section more like the starting point of a sentiment repair, or a pause before a continuation lower? The above is market observation and does not constitute investment advice. This is Niu Niu Shuo in the crypto space.
展開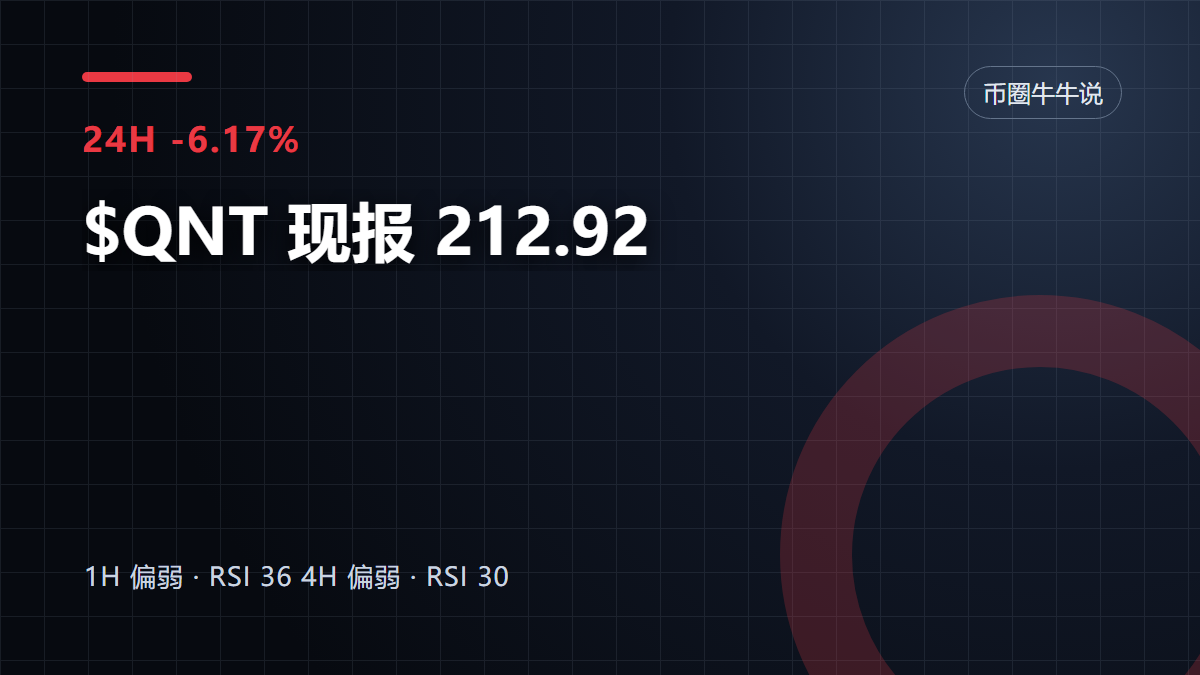
本頁僅供研究參考,不構成投資建議。模型可能出錯。過往表現不代表未來結果。