D
Duquesne Family Office LLC
+ 持有Q
+9.50%
3個月報酬率
$109.830
+1.065 (+0.97%)收盤時
Qnity Electronics, Inc. is engaged in providing materials and solutions for semiconductor and electronics industries. The Company has two business segments, namely Semiconductor Technologies and Interconnect Solutions. The Semiconductor Technologies segment provides a portfolio of materials and solutions utilized across multiple stages of the semiconductor manufacturing process. These materials are integrated into customers' roadmaps and are intended to support improvements in chip performance, production yield, and the implementation of advanced node technologies. The Interconnect Solutions segment offers a comprehensive range of material solutions that address the complexities of signal integrity, thermal and power management, and advanced packaging. These solutions are used in advanced electronics hardware applications, including complex printed circuit boards and advanced semiconductor packaging.
Currently, Qnity Electronics Inc is not a strong buy due to its low RSI of 25.369, indicating oversold conditions, and a current price of $109.83, which is significantly below the analyst price target range of $160 to $211. However, the stock has shown a year-to-date change of +29.24%, suggesting potential for recovery. The main risk is the recent 5-day change of -4.80%, indicating short-term volatility.
Qnity Electronics, Inc. is engaged in providing materials and solutions for semiconductor and electronics industries. The Company has two business segments, namely Semiconductor Technologies and Interconnect Solutions. The Semiconductor Technologies segment provides a portfolio of materials and solutions utilized across multiple stages of the semiconductor manufacturing process. These materials are integrated into customers' roadmaps and are intended to support improvements in chip performance, production yield, and the implementation of advanced node technologies. The Interconnect Solutions segment offers a comprehensive range of material solutions that address the complexities of signal integrity, thermal and power management, and advanced packaging. These solutions are used in advanced electronics hardware applications, including complex printed circuit boards and advanced semiconductor packaging. It operates in the Technology sector.
Currently, Qnity Electronics Inc is not a strong buy due to its low RSI of 25.369, indicating oversold conditions, and a current price of $109.83, which is significantly below the analyst price target range of $160 to $211. However, the stock has shown a year-to-date change of +29.24%, suggesting potential for recovery. The main risk is the recent 5-day change of -4.80%, indicating short-term volatility.

🚨 Q/USDT IS BOUNCING BACK 🫣 BUT IS THE RECOVERY STRONG ENOUGH? Q has dropped 28.67% in 24 hours, but buyers have stepped in near $0.0686, pushing the price back to $0.0852. Rising volume and a recovering RSI suggest short-term buying momentum is returning, but the downtrend still needs confirmation before calling a reversal. 📈 Bullish scenario: Holding above $0.0686 and breaking toward $0.1019 could strengthen recovery. 📉 Bearish scenario: If the bounce loses momentum, Q could retest the $0.0686 support zone. 👀 Key levels to watch 🟢 Support: $0.0686116 🔴 Resistance: $0.1018617 💡 Trader takeaway: After a sharp fall, the first bounce can be tempting—but don’t confuse relief buying with a confirmed trend reversal. Watch how price reacts at resistance, and manage risk before entering. $Q $Q
展開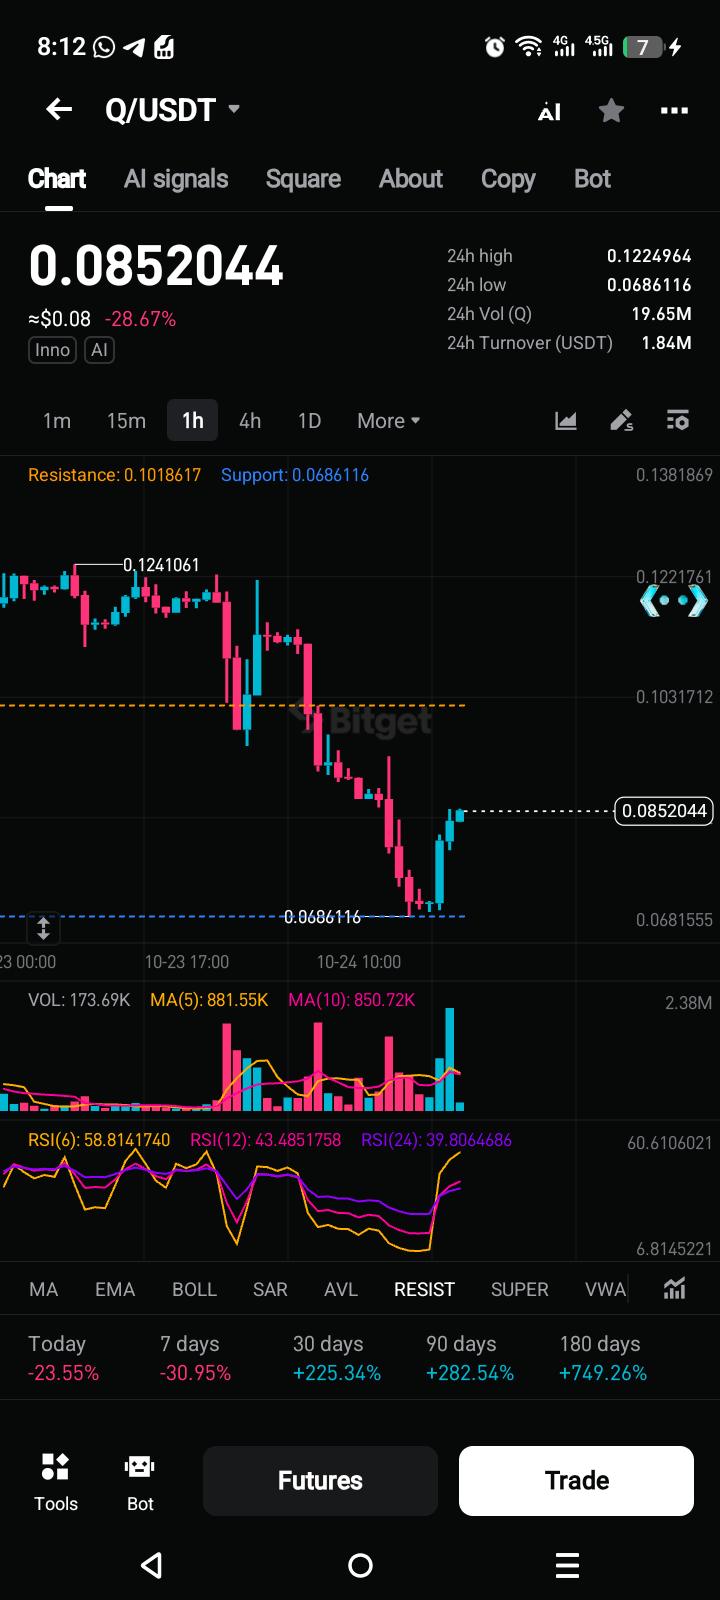

$Q at $0.1205 — After the $0.216977 Wick From a $0.060738 low to a $0.216977 top, now basing at $0.120504 on the 1H. Resistance: $0.1316 / $0.156044 / $0.190416 Support: $0.087299 / $0.0607 I'm not chasing a long here. Holding $0.12 points to a bounce toward $0.156; losing $0.087 means a return to $0.06. Are you buying $Q at $0.12 or waiting?
展開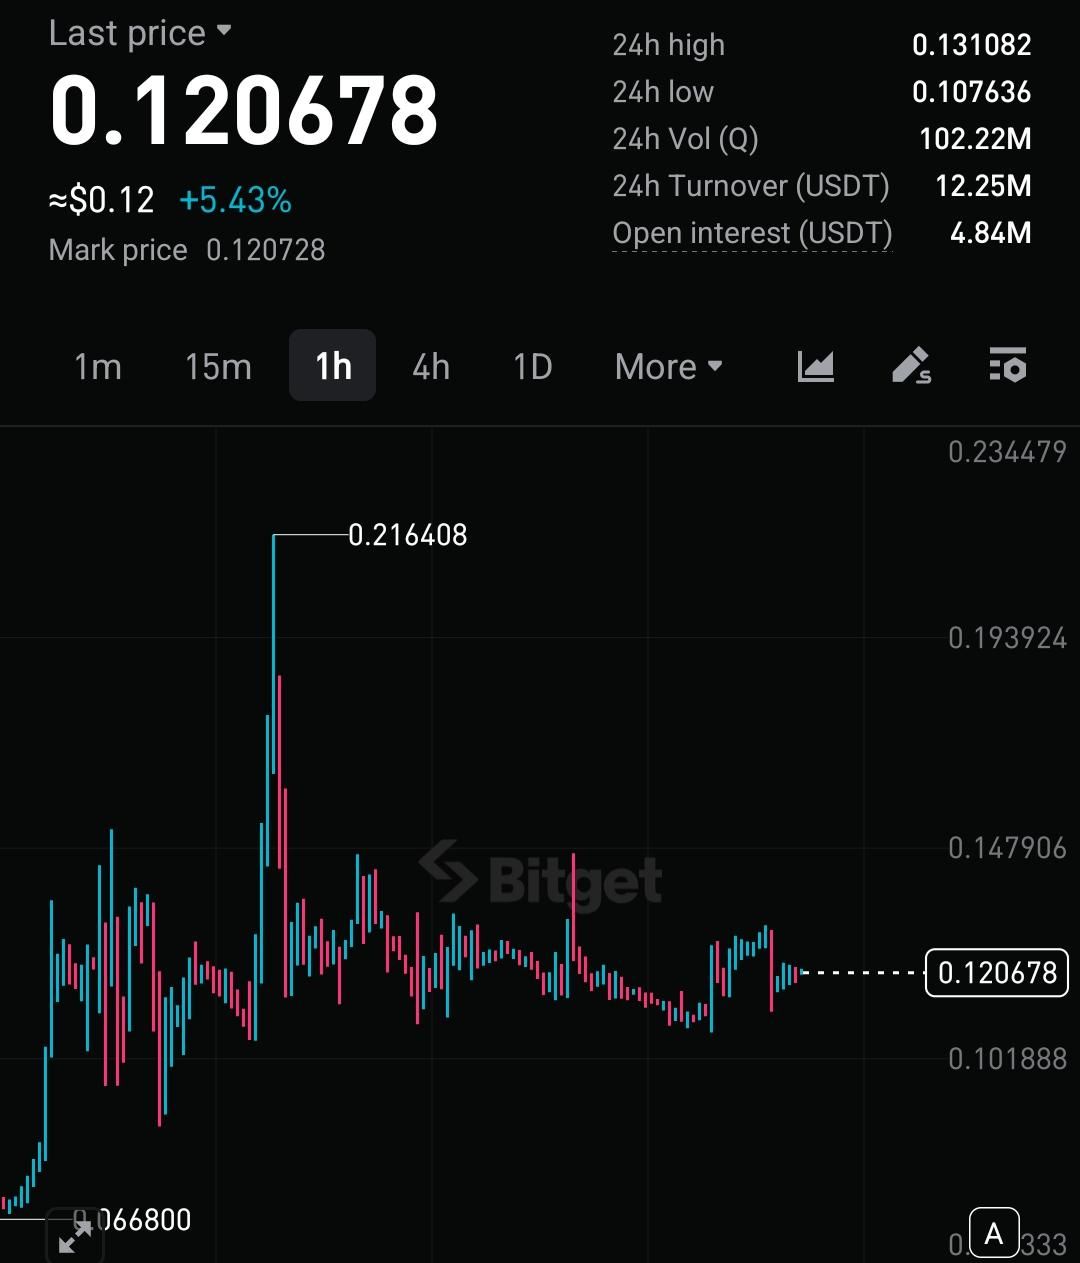
$BR $Q $KERNEL I've just received my second withdrawal of $67,200 through CY WATSON's Copy Trading Insights, and honestly, I'm still taking it all in. When I started this journey, I never imagined I'd reach milestones like this or see my crypto goals come closer to reality. What stands out to me is his disciplined approach, consistent market analysis, and structured trading insights. My experience has been remarkable, and I'm grateful for the progress I've made. If you're looking to improve your understanding of crypto trading, CY WATSON's approach is certainly worth exploring. His username is in the comments below for anyone who wants to take a look.
展開📈 Q IS SHOWING SIGNS OF RECOVERY — CAN BUYERS BREAK RESISTANCE? 👀 After a 5.73% gain, $Q is trading around $0.1217500, with buyers attempting to recover after a recent pullback from the $0.1310 resistance area. RSI(6) is near 51.20, indicating relatively neutral momentum. The next move may depend on whether buyers can maintain pressure and reclaim the key resistance zone. 📈 If buyers break above $0.1310166 with strong volume, further upside could follow. However, rejection at resistance may lead to another pullback toward $0.1078474. 👀 Key levels to watch: 🟢 Support: $0.1078474 🔴 Resistance: $0.1310166 Stay patient, wait for breakout confirmation, and always manage your risk. $Q $MAGMA $BTC
展開
🚨 Q/USDT — Key Levels to Watch | High-Volatility Setup 🔥 Q is showing a powerful longer-term rally, but short-term momentum needs confirmation! 💰 Current Price: $0.1185867 🟢 24H Change: +2.22% 📈 24H High: $0.1310166 📉 24H Low: $0.1078474 💵 24H Turnover: $1.65M 📊 Technical Analysis Q has delivered an impressive rally across multiple timeframes, but the current price is slightly below its key moving averages, indicating possible short-term consolidation. MA(5): $0.1223606 MA(10): $0.1233680 MA(20): $0.1189616 🟢 Immediate Support: $0.1172–$0.1160 🟢 Major Support: $0.1078–$0.1068 🔴 Immediate Resistance: $0.1224–$0.1234 🔴 Major Resistance: $0.1289–$0.1310 🎯 Upside Watch: $0.1405, followed by $0.1509 if bullish momentum returns. 🐂 Bullish Scenario: A strong breakout above $0.1234 with rising buying volume could open the door toward $0.1289–$0.1310. A confirmed break above this zone could strengthen the next upward move. 🐻 Bearish Scenario: If Q fails to reclaim the moving averages and loses $0.1160, selling pressure could push the price toward $0.1078–$0.1068. 📈 Volume Confirmation: Q has gained +128.30% in 7 days and +353.55% in 30 days, highlighting its strong recent performance. However, after such a rapid rally, volatility and profit-taking risk remain elevated. Watch for increasing volume on a breakout rather than relying on price movement alone. 🔥 Trading Action: Watch $0.1234 for bullish confirmation and $0.1160 for potential weakness. Avoid chasing sudden pumps; wait for a confirmed breakout or a clear support reaction. 💬 Your call: Can Q break $0.1310 and continue toward $0.1405, or will sellers take control? Educational purposes only — not financial advice. $Q $STRK $NEAR
展開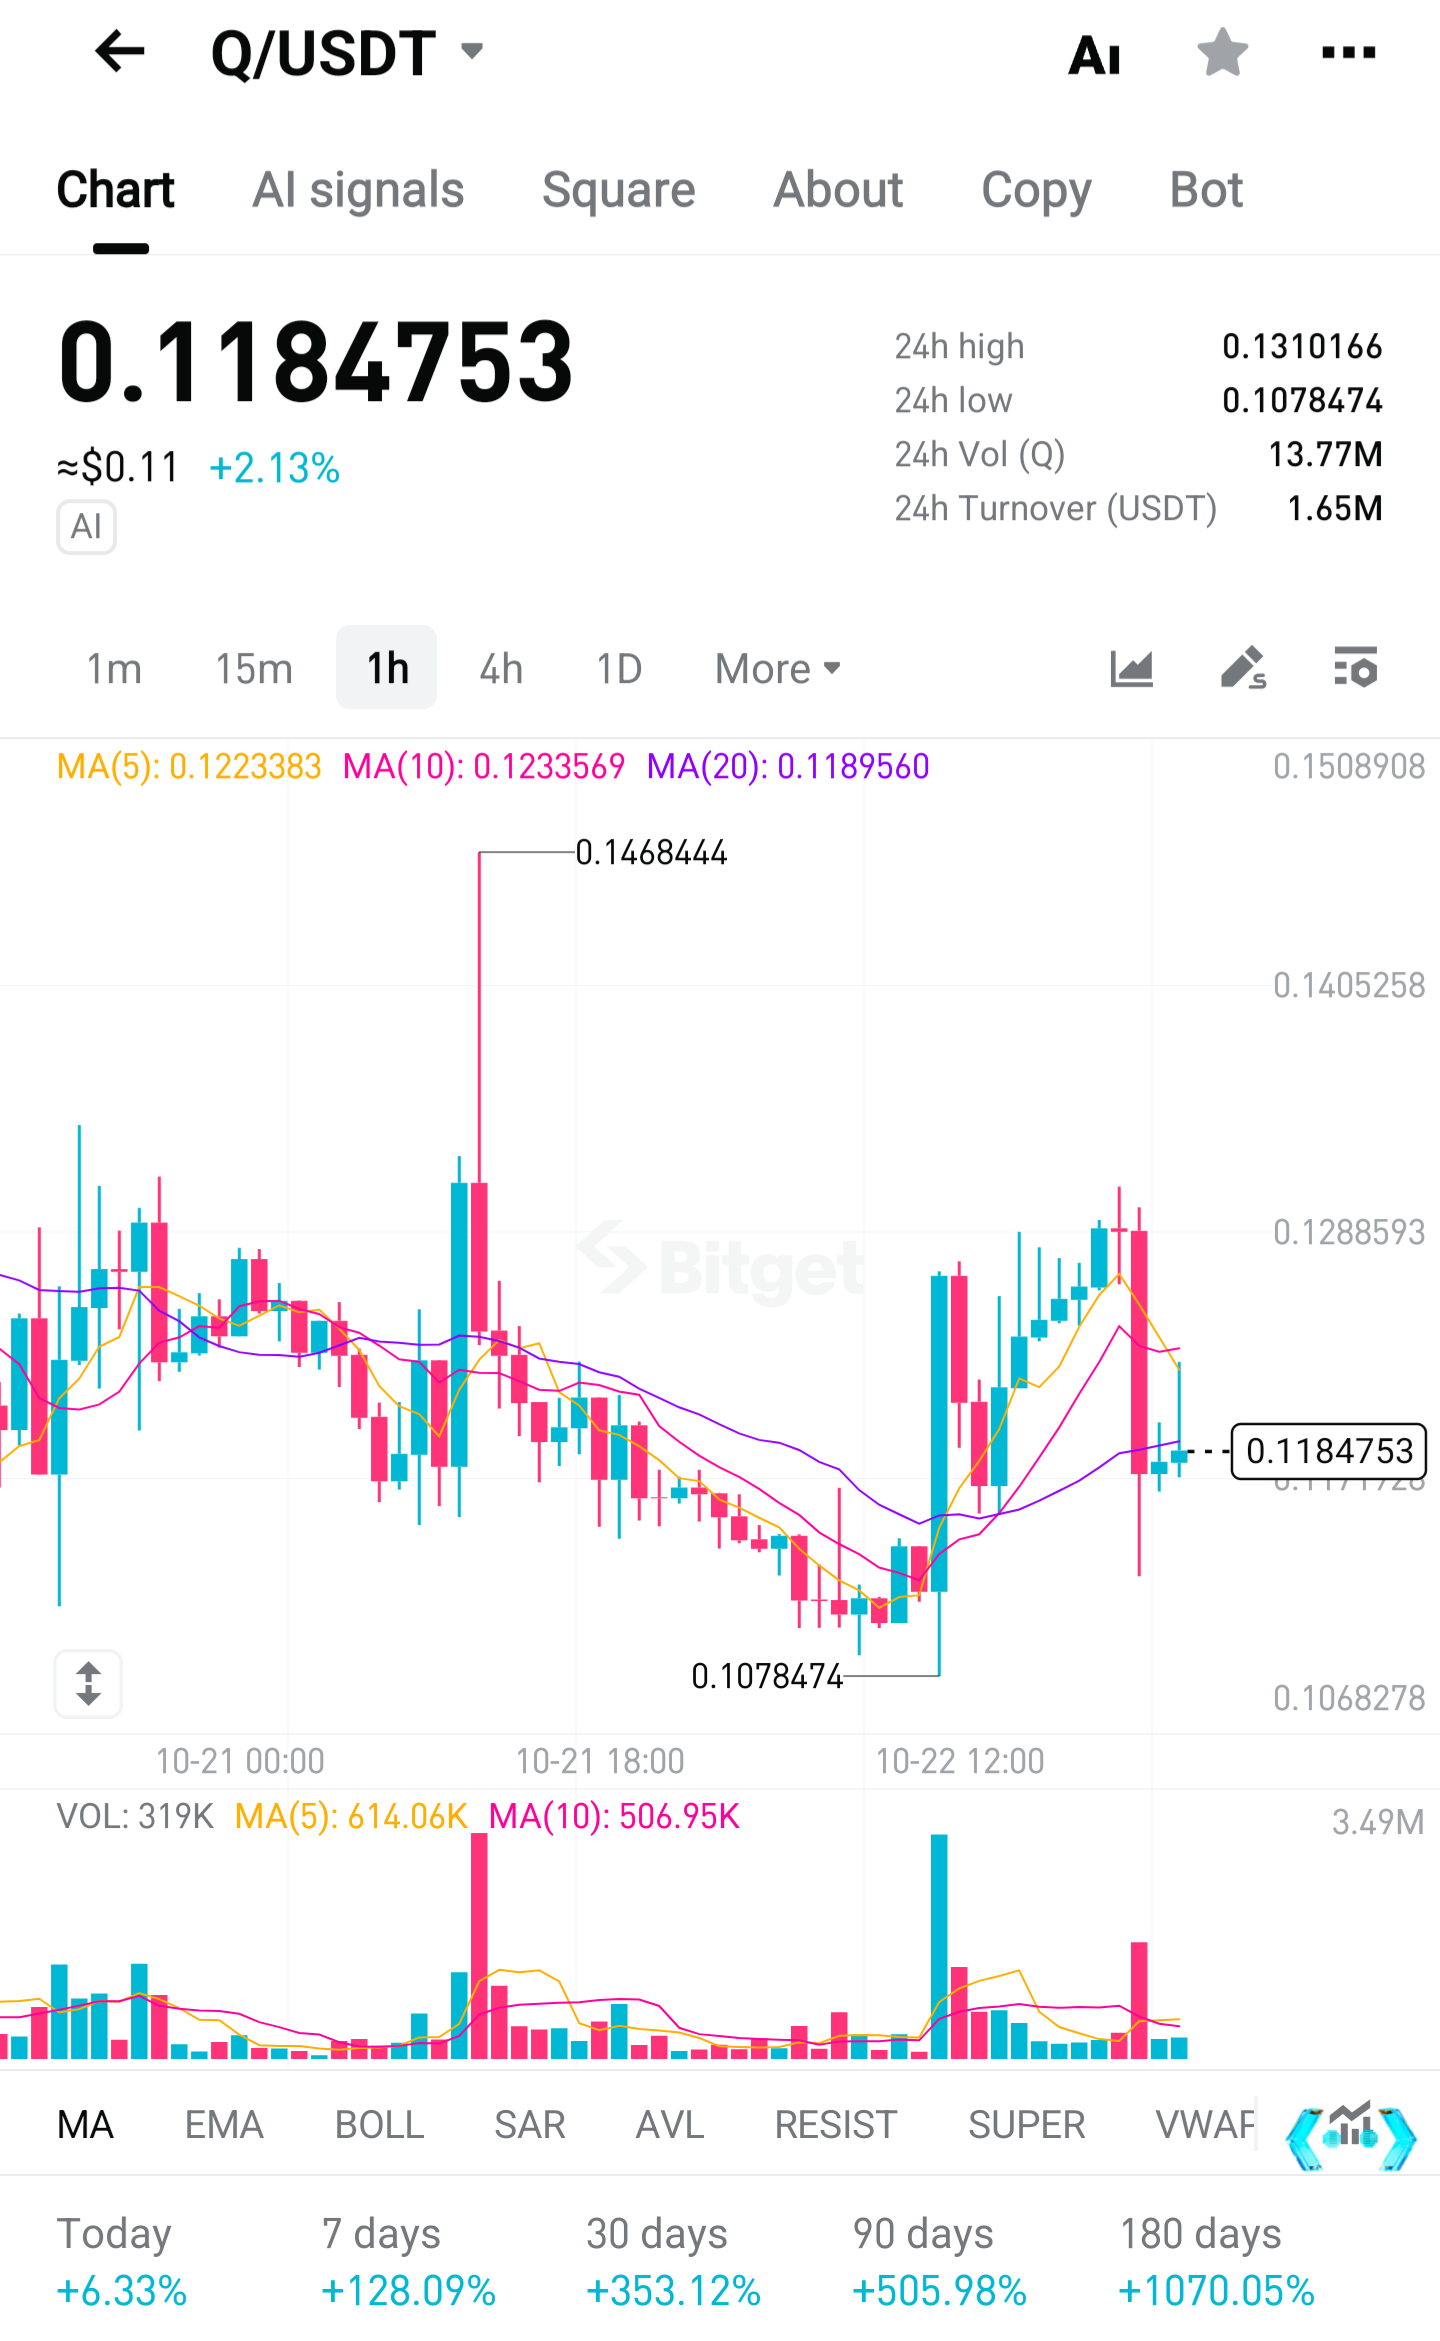
本頁僅供研究參考,不構成投資建議。模型可能出錯。過往表現不代表未來結果。