樂
樂觀
樂觀 · 25%FROG
$47.21
情境價格
$100.620
+7.214 (+7.17%)收盤時
JFrog Ltd. provides an end-to-end, hybrid, universal Software Supply Chain Platform. The Company’s solutions include The JFrog Artifactory, JFrog Curation, JFrog Xray (Security Essentials), JFrog Advanced Security, JFrog Runtime Security, JFrog Distribution, JFrog Connect, and JFrog ML. JFrog Artifactory supports all software package technologies and can be seamlessly deployed across public clouds, multi-cloud, on-premises, private cloud, and hybrid environments. JFrog Curation understands package metadata, allowing companies to build policies around the entry or blocking of software packages into a company’s repositories based on multiple factors such as age, version number, security risk, release timelines, target environments, and more. JFrog Distribution provides reliable, scalable, and secure software package distribution with enterprise-grade performance. JFrog Xray continuously scans JFrog Artifactory to secure all software packages stored in it.
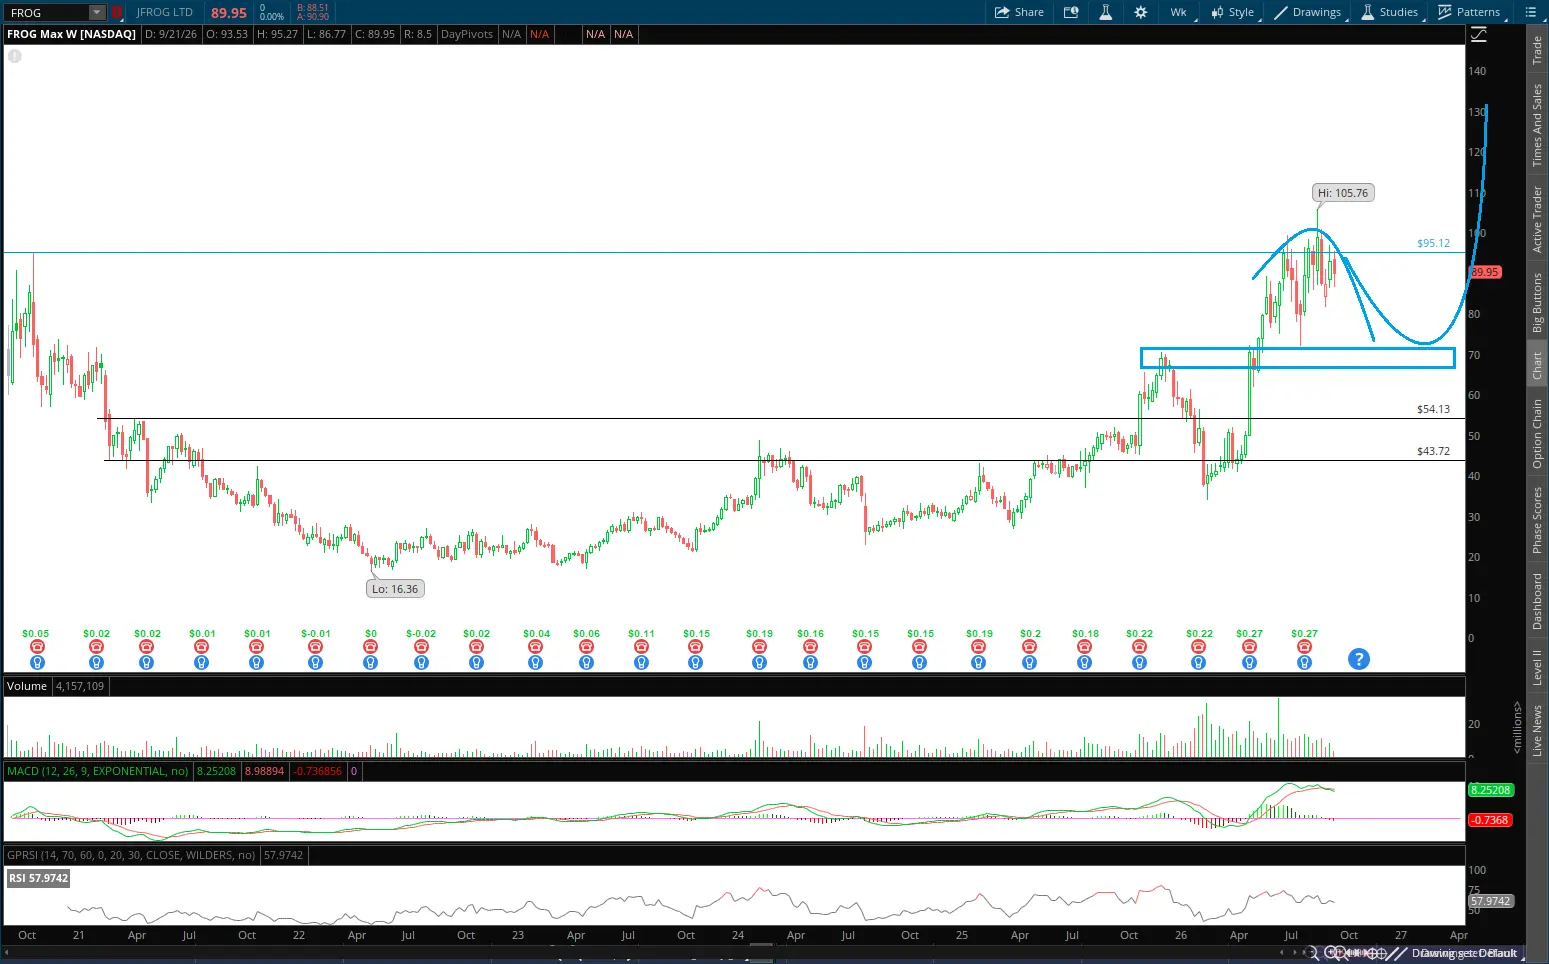
JFrog Ltd is a good buy right now due to its strong recent performance, with a current price of $100.62 and a year-to-date change of +68.91%. The stock has a positive momentum indicated by an RSI of 63.17, suggesting it is not overbought yet. Additionally, analysts have set a price target of $118, indicating a potential upside of 17.3% from the current price. The main risk is the negative net income trend, with a net loss of $4.17 million in Q2 2026, which could affect investor sentiment if not addressed.
情境價格取自當年最後一個月度預測區間。機率為固定的模型權重(25 / 50 / 25),不構成保證。

JFrog Unveils New AI Security Features for Software Supply Chain

JFrog Launches DORA Compliance Framework and AI Verification Policies
JFrog CFO Sells 17,216 Shares Amid Strong Business Performance
JFrog CFO Sells Shares to Meet Tax Obligations

JFrog Unveils New Platform Capabilities to Ensure AI Agent Security
JFrog Ltd. provides an end-to-end, hybrid, universal Software Supply Chain Platform. The Company’s solutions include The JFrog Artifactory, JFrog Curation, JFrog Xray (Security Essentials), JFrog Advanced Security, JFrog Runtime Security, JFrog Distribution, JFrog Connect, and JFrog ML. JFrog Artifactory supports all software package technologies and can be seamlessly deployed across public clouds, multi-cloud, on-premises, private cloud, and hybrid environments. JFrog Curation understands package metadata, allowing companies to build policies around the entry or blocking of software packages into a company’s repositories based on multiple factors such as age, version number, security risk, release timelines, target environments, and more. JFrog Distribution provides reliable, scalable, and secure software package distribution with enterprise-grade performance. JFrog Xray continuously scans JFrog Artifactory to secure all software packages stored in it. It operates in the Technology sector (SERVICES-PREPACKAGED SOFTWARE industry).
JFrog Ltd is a good buy right now due to its strong recent performance, with a current price of $100.62 and a year-to-date change of +68.91%. The stock has a positive momentum indicated by an RSI of 63.17, suggesting it is not overbought yet. Additionally, analysts have set a price target of $118, indicating a potential upside of 17.3% from the current price. The main risk is the negative net income trend, with a net loss of $4.17 million in Q2 2026, which could affect investor sentiment if not addressed.



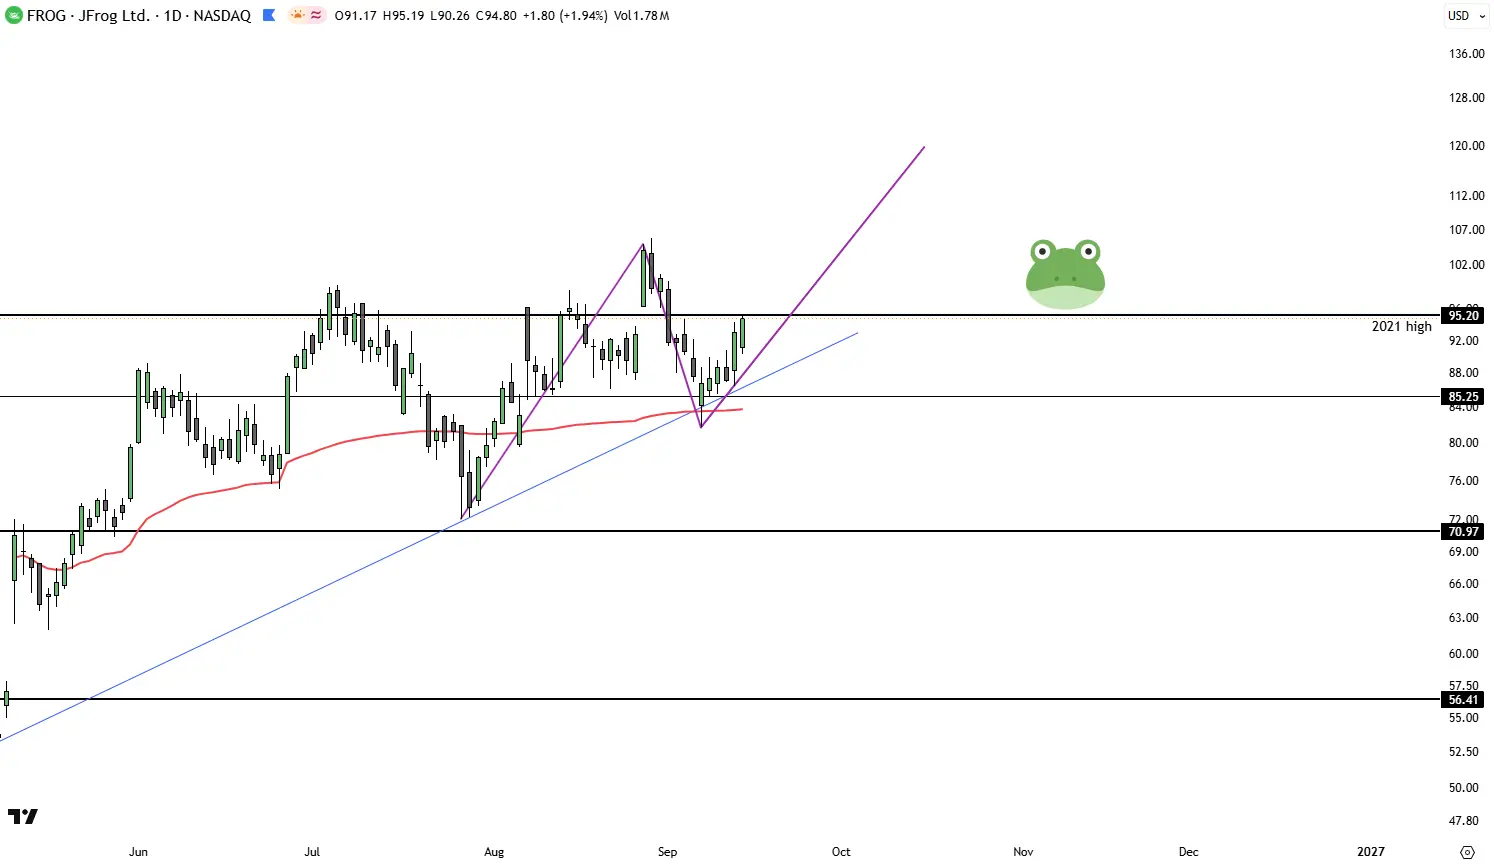
Earlier today, over $540,000 of $FROG $100 calls for 11/20 were bought 🐸 The stock is only trading around $90 right now.
展開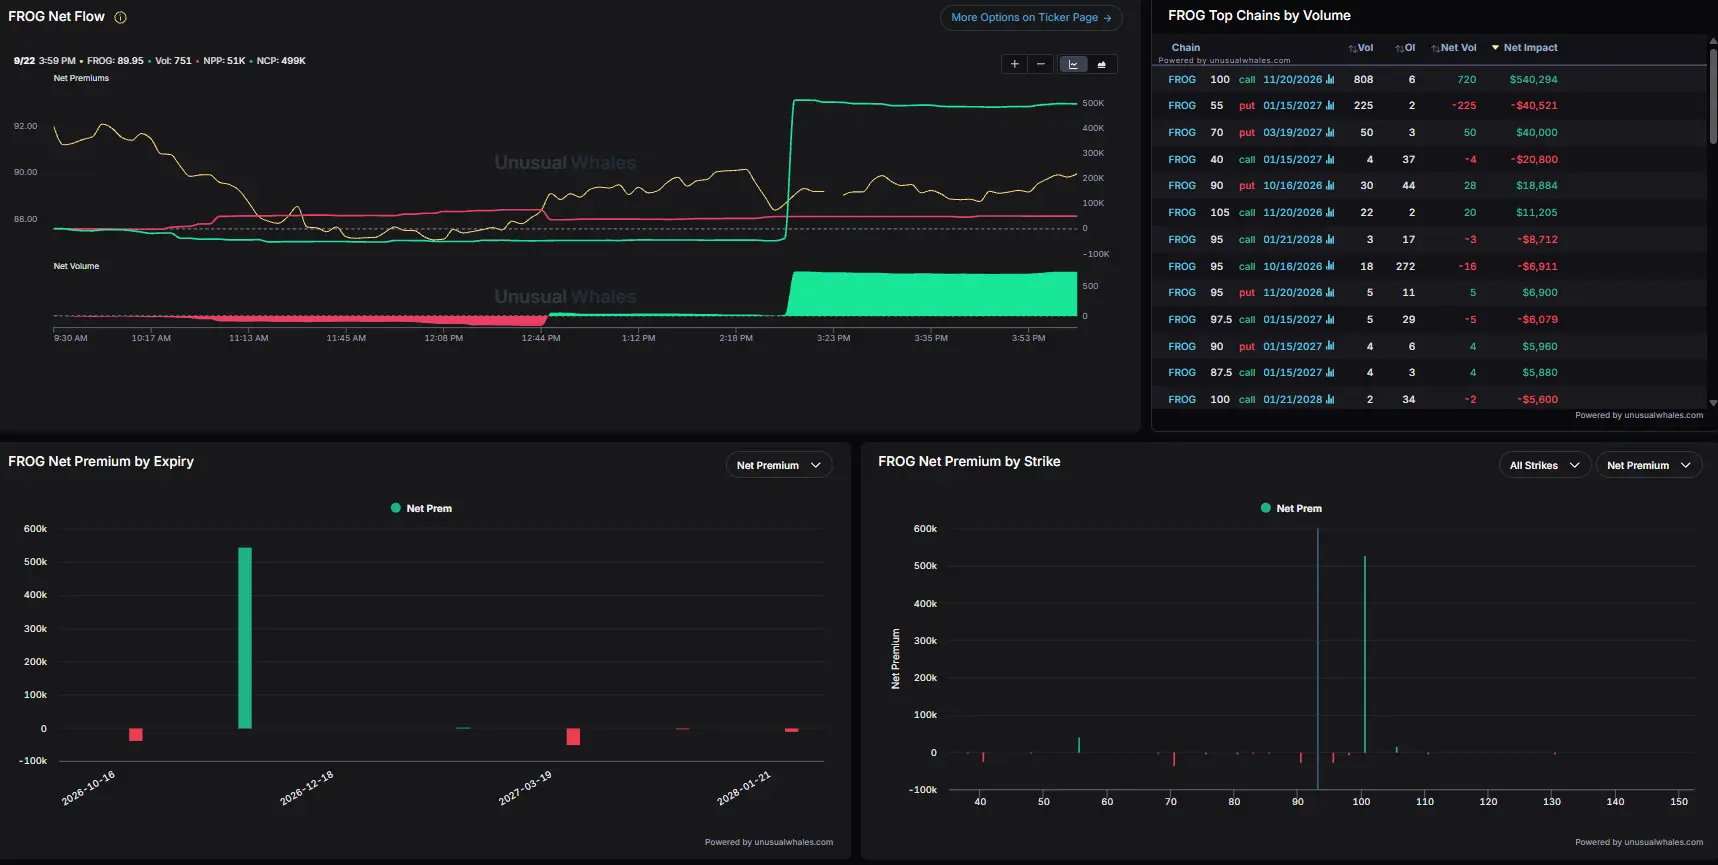

本頁僅供研究參考,不構成投資建議。模型可能出錯。過往表現不代表未來結果。