
樂
樂觀
樂觀 · 25%EDN
$140.71
情境價格
$18.570
-0.238 (-1.28%)收盤時
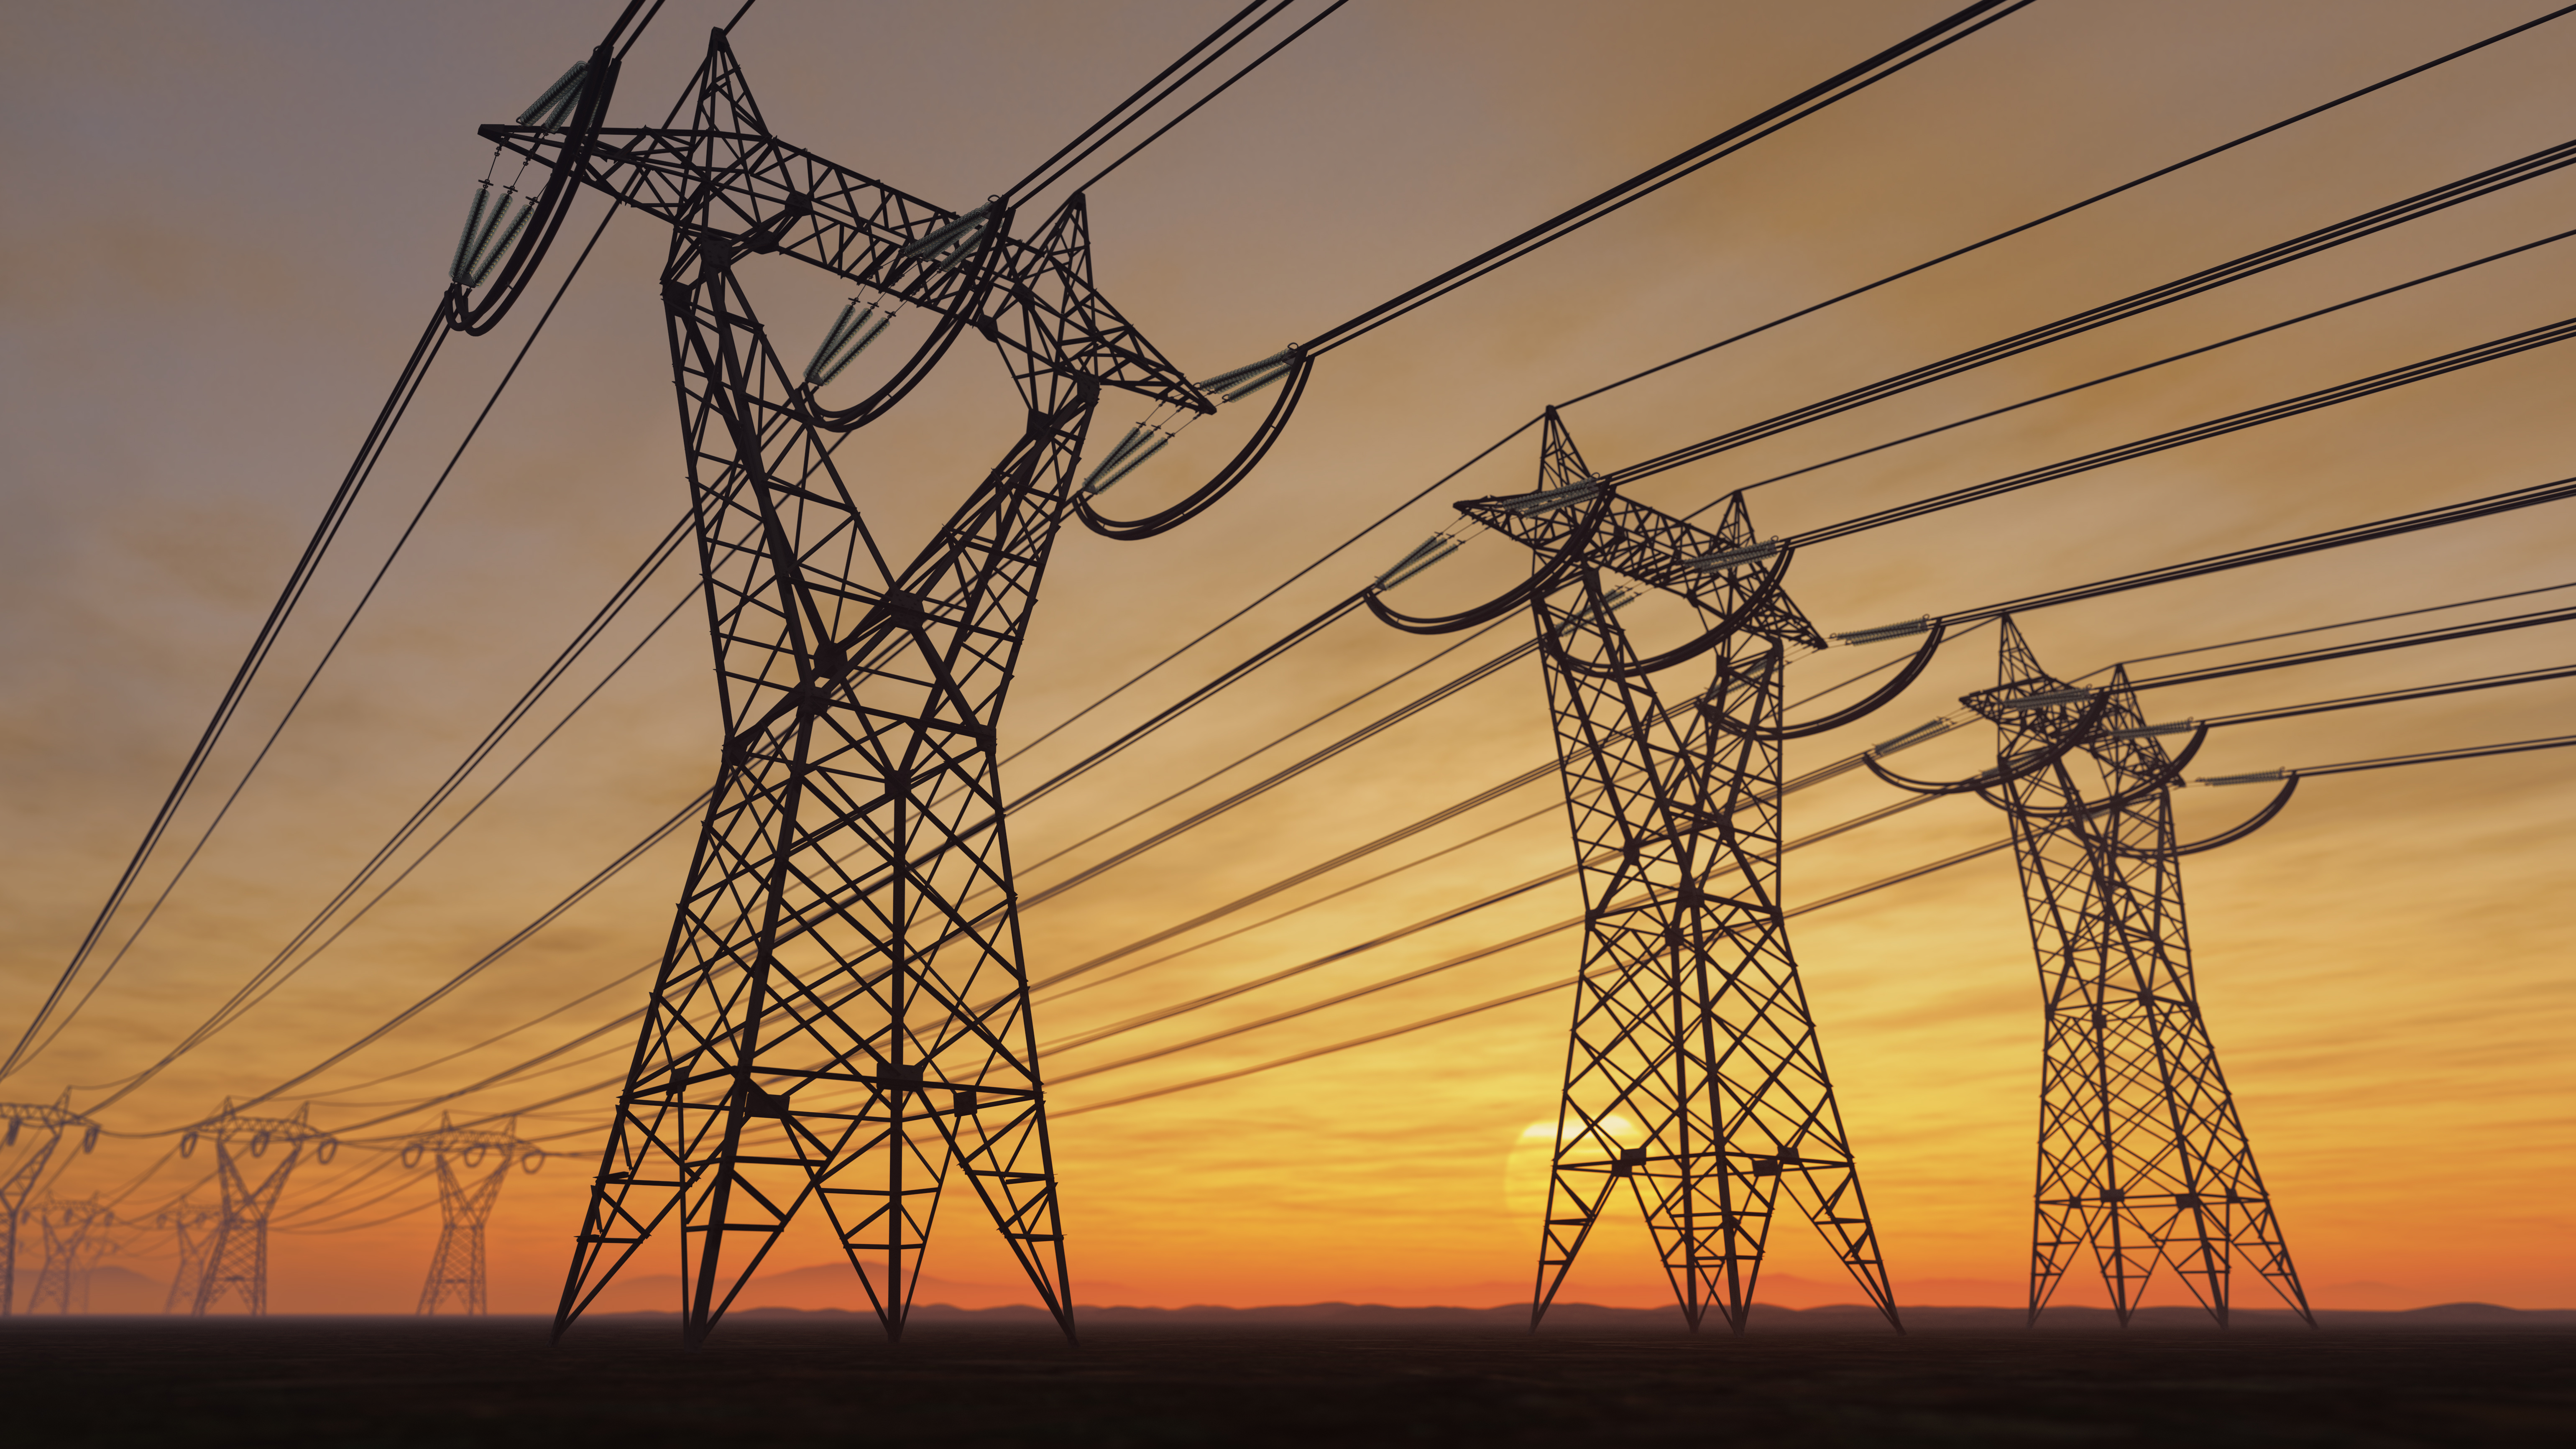
Empresa Distribuidora y Comercializadora Norte S.A. is a public service company. The Company is engaged in electricity distribution in Argentina. It holds a concession to distribute electricity to the northwestern part of the greater Buenos Aires metropolitan area and in the northern part of the City of Buenos Aires. The Company's concession area of approximately 4,637 square kilometers is divided into three operating territories: Region I, which consists of over 251 square kilometers; Region II, which consists of approximately 1,761 square kilometers, and Region III, which consists of over 2,625 square kilometers. Region I includes Ciudad de Buenos Aires, San Isidro, Vicente Lopez, San Martin and Tres de Febrero districts. Region II includes La Matanza, Moron, Hurlingham, Ituzaingo, Merlo, Marcos Paz and Gral. Las Heras districts. Region III includes Pilar, Escobar, Tigre, San Fernando, San Miguel, Malvinas Argentinas, Jose C. Paz, Moreno and Gral. Rodriguez districts.
Currently, EDN is not a strong buy due to its low RSI of 39.626, indicating potential oversold conditions, and a forward P/E ratio of 8.7489, which suggests the stock may be undervalued but also reflects uncertainty in future earnings. The stock has experienced a significant year-to-date decline of 31.46%, which raises concerns about its recovery potential. The main risk is its recent performance, with a 20-day change of -12.85%, indicating a downward trend that could continue.
Morgan Stanley
$36
2025-08-19
Morgan Stanley
2025-08-19
目標價
$36
情境價格取自當年最後一個月度預測區間。機率為固定的模型權重(25 / 50 / 25),不構成保證。

Edenor Files 2025 Annual Report with SEC
Utility Companies EPS Revision Grades Highlighted Ahead of Earnings Season

EDN Stock Fluctuations: 52-Week Low at $14.38, High at $40.64

Axsome Therapeutics Plans New Drug Application for AXS-12 in January, Shares Surge 16.1%

Benzinga Factor Investing Framework Enhances Value Stock Recovery
Empresa Distribuidora y Comercializadora Norte S.A. is a public service company. The Company is engaged in electricity distribution in Argentina. It holds a concession to distribute electricity to the northwestern part of the greater Buenos Aires metropolitan area and in the northern part of the City of Buenos Aires. The Company's concession area of approximately 4,637 square kilometers is divided into three operating territories: Region I, which consists of over 251 square kilometers; Region II, which consists of approximately 1,761 square kilometers, and Region III, which consists of over 2,625 square kilometers. Region I includes Ciudad de Buenos Aires, San Isidro, Vicente Lopez, San Martin and Tres de Febrero districts. Region II includes La Matanza, Moron, Hurlingham, Ituzaingo, Merlo, Marcos Paz and Gral. Las Heras districts. Region III includes Pilar, Escobar, Tigre, San Fernando, San Miguel, Malvinas Argentinas, Jose C. Paz, Moreno and Gral. Rodriguez districts. It operates in the Utilities sector (ELECTRIC SERVICES industry).
Currently, EDN is not a strong buy due to its low RSI of 39.626, indicating potential oversold conditions, and a forward P/E ratio of 8.7489, which suggests the stock may be undervalued but also reflects uncertainty in future earnings. The stock has experienced a significant year-to-date decline of 31.46%, which raises concerns about its recovery potential. The main risk is its recent performance, with a 20-day change of -12.85%, indicating a downward trend that could continue.
4 analysts cover EDN: 3 rate it Buy, 1 Hold and 0 Sell.
暫無貼文
註冊或登入後參與討論本頁僅供研究參考,不構成投資建議。模型可能出錯。過往表現不代表未來結果。