
樂
樂觀
樂觀 · 25%DOW
$33.68
情境價格
$31.810
+1.498 (+4.71%)收盤時
Dow Inc. serves as a holding company for The Dow Chemical Company and its subsidiaries. The Company conducts its operations through six global businesses, which are organized into segments, such as Packaging & Specialty Plastics, Industrial Intermediates & Infrastructure and Performance Materials & Coatings. Packaging & Specialty Plastics segment consists of two integrated global businesses: Hydrocarbons & Energy and Packaging and Specialty Plastics. This segment employs a polyolefin product portfolio. Industrial Intermediates & Infrastructure segment consists of two customer-centric global businesses: Industrial Solutions and Polyurethanes & Construction Chemicals that develop intermediate chemicals that are essential to manufacturing processes, as well as downstream, customized materials and formulations that use advanced development technologies. Performance Materials & Coatings segment consists of two global businesses: Coatings & Performance Monomers and Consumer Solutions.
Dow Inc. is currently trading at $29.93, which is below the average analyst price target of $30. The stock has shown a strong year-to-date change of +23.32% and a 1-year change of +38.37%. However, the RSI is at 76.855, indicating it may be overbought. The main risk is the recent downgrade by multiple analysts, with RBC expecting weaker Q3 EBITDA due to lower polyethylene prices. Given these factors, it may be prudent to hold rather than buy at this time.
情境價格取自當年最後一個月度預測區間。機率為固定的模型權重(25 / 50 / 25),不構成保證。

Market Update: Tech Stocks Decline Amid Earnings Reports
Dow Chemical Reports Strong Q3 Results Driven by Strategic Initiatives

Tech Stocks Rebound Drives Market Higher

Nuclear Market Resurgence: Competition Between Oklo and X-Energy

BofA Upgrades Dow and Raises Price Target Amid Stronger Demand
Dow Inc. serves as a holding company for The Dow Chemical Company and its subsidiaries. The Company conducts its operations through six global businesses, which are organized into segments, such as Packaging & Specialty Plastics, Industrial Intermediates & Infrastructure and Performance Materials & Coatings. Packaging & Specialty Plastics segment consists of two integrated global businesses: Hydrocarbons & Energy and Packaging and Specialty Plastics. This segment employs a polyolefin product portfolio. Industrial Intermediates & Infrastructure segment consists of two customer-centric global businesses: Industrial Solutions and Polyurethanes & Construction Chemicals that develop intermediate chemicals that are essential to manufacturing processes, as well as downstream, customized materials and formulations that use advanced development technologies. Performance Materials & Coatings segment consists of two global businesses: Coatings & Performance Monomers and Consumer Solutions. It operates in the Basic Materials sector (PLASTIC MATERIALS, SYNTH RESINS & NONVULCAN ELASTO industry).
Dow Inc. is currently trading at $29.93, which is below the average analyst price target of $30. The stock has shown a strong year-to-date change of +23.32% and a 1-year change of +38.37%. However, the RSI is at 76.855, indicating it may be overbought. The main risk is the recent downgrade by multiple analysts, with RBC expecting weaker Q3 EBITDA due to lower polyethylene prices. Given these factors, it may be prudent to hold rather than buy at this time.

Yesterday Iran threatened to cut off the global internet (not a joke). Iran's Revolutionary Guard said it might target undersea cables passing through the Strait of Hormuz... "all global internet and commercial data depend on them." The same day, the Dow rose hundreds of points. The market has already been through this year: war with Iran and closure of the Strait of Hormuz; oil fell from about $118 to $70... then back above $100; tankers attacked almost weekly; and now threats against the internet itself. Yet the S&P is still only a few percent from its all-time high, up 12% this year (see chart). If those cables actually fail, that is a real event, and the market will react. I am not saying it won't. But threats alone rarely move the market for long. What really matters is earnings... So I don't trade based on headlines. I treat the volatility they bring as an opportunity for long-term trades.
展開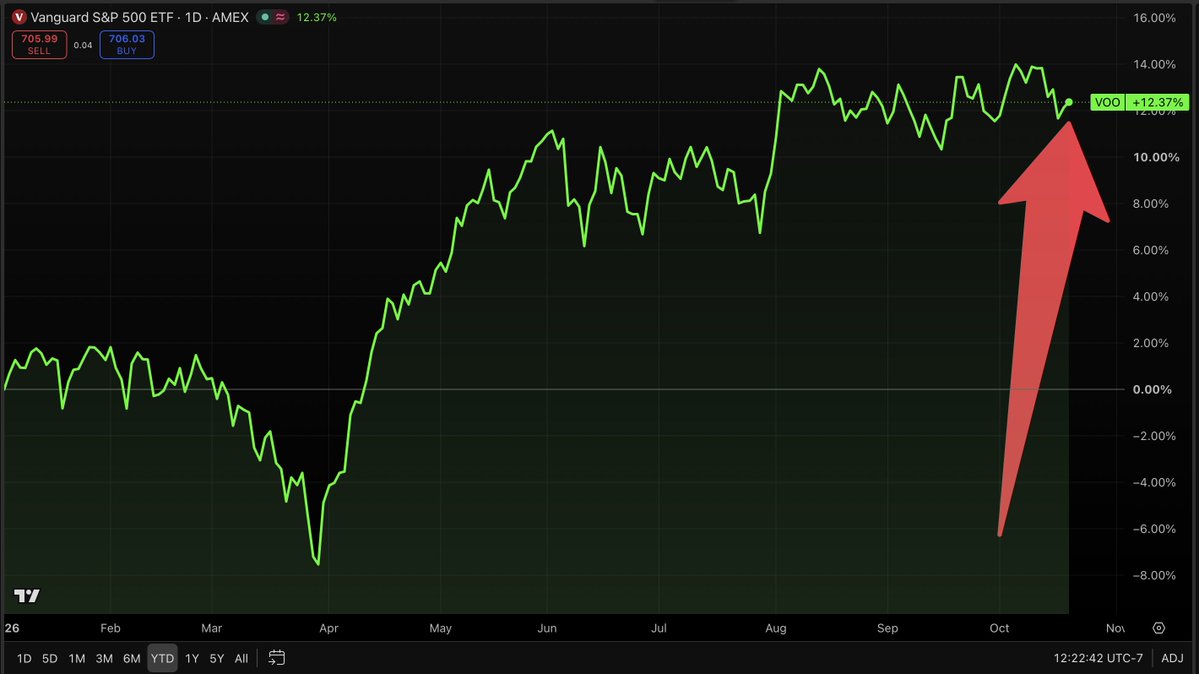

#USStocksRecordSixthLargestWeeklyInflowSince2008 US stocks recorded the sixth-largest weekly inflow since 2008! 📈💰 With U.S. equities recording their sixth-largest weekly inflow since 2008, an important capital flow signal is emerging in global financial markets. The scale of funds flowing into U.S. stocks highlights continued investor demand for U.S. risk assets and reinforces the importance of equity fund flows as a market sentiment indicator. 💵 Why do these inflows matter? Weekly fund flows help show how investors are allocating capital. When large amounts of money flow into stocks, it may indicate stronger demand for equities, greater investor confidence in corporate earnings, or a preference for risk assets over other investment categories. The latest inflow is notable because its scale ranks among the largest weekly inflows since 2008, making it a significant development rather than ordinary weekly market activity. 📊 Potential market impact Strong capital inflows can provide additional liquidity to the stock market and potentially support prices when buying demand persists. If investors continue allocating funds to equities, major U.S. benchmarks — including the S&P 500, Nasdaq, and Dow Jones — may continue to benefit. Technology and AI-related companies are especially important to the current market narrative. Strong earnings expectations, investment in AI infrastructure, semiconductor demand, and expectations for future productivity growth all help keep U.S. equities at the center of investor attention. 🔥 Investor confidence remains a key theme The scale of the inflows suggests many investors still view U.S. equities as an important destination for capital allocation. Despite concerns about inflation, interest rates, economic growth, geopolitical risk, and market valuations, demand for U.S. stocks remains considerable. However, strong inflows should not automatically be interpreted as a guarantee that prices will keep rising. 📌 What traders should watch next Investors will closely watch: • Federal Reserve policy and rate expectations • Inflation and employment data • Corporate earnings and forward guidance • S&P 500 and Nasdaq momentum • Technology and semiconductor performance • Institutional fund flows • Bond yields and the U.S. dollar • Overall risk appetite in global markets If strong inflows persist week after week, they could reinforce the bullish market narrative. On the other hand, a sharp slowdown or reversal in fund flows could indicate that investors are becoming more cautious. 🌎 The bigger picture The U.S. remains the dominant destination for global equity capital, and this unusually large weekly inflow shows that U.S. markets remain critically important to both institutional and retail investors. For traders, the key is not only watching whether money enters the market, but also where those flows are going and whether the trend remains sustainable. A combination of strong fund flows, solid corporate earnings, favorable liquidity conditions, and improving investor sentiment could create a favorable environment for equities. But elevated valuations and macroeconomic uncertainty mean risk management remains essential. ⚠️ Risk note: Large investment inflows are an important market signal, but they do not guarantee future returns. Markets can reverse quickly. Always do your own research, manage position size carefully, and use appropriate risk management measures. U.S. equity fund flows are sending a strong signal: investor demand for U.S. stocks remains firmly in focus. #USStocks #StockMarket #WallStreet
展開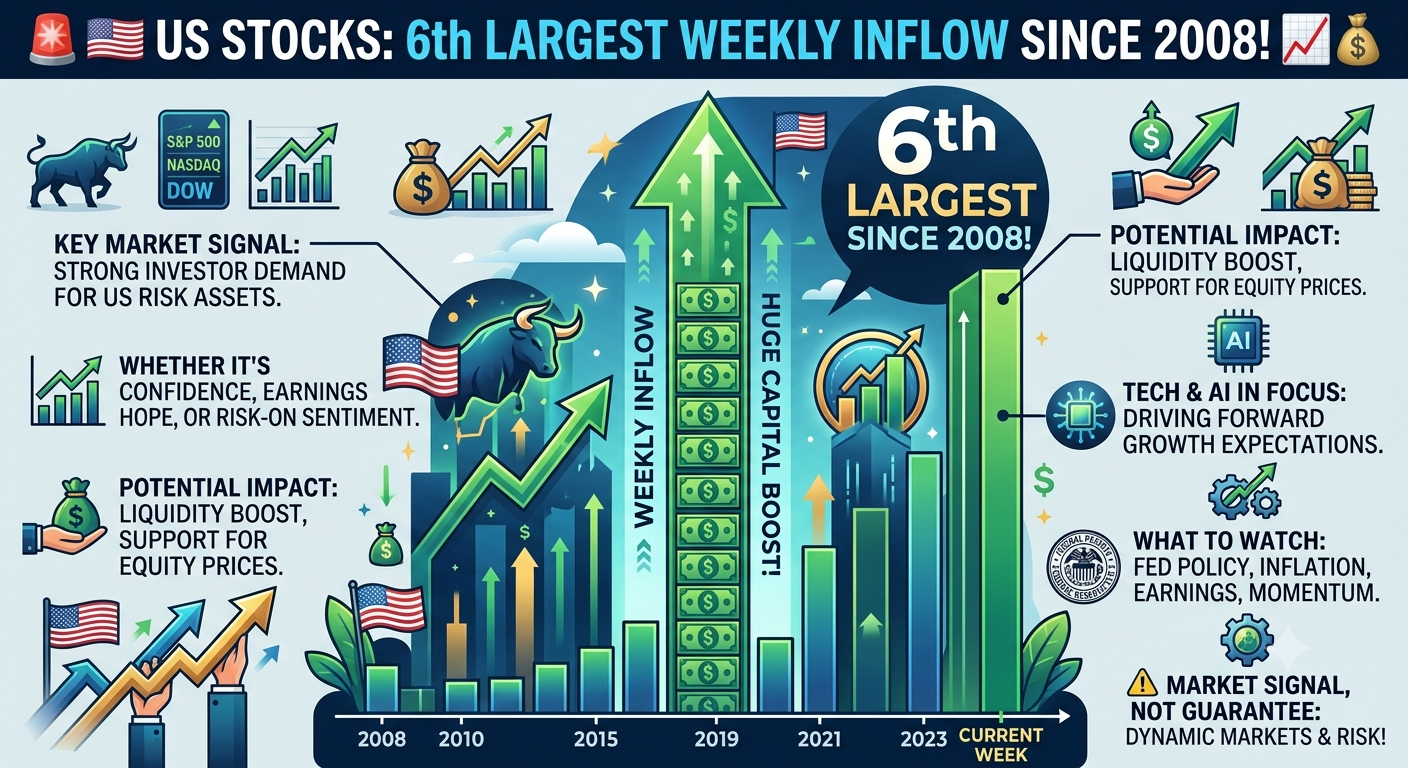
本頁僅供研究參考,不構成投資建議。模型可能出錯。過往表現不代表未來結果。