樂
樂觀
樂觀 · 25%AMP
$712.23
情境價格
$492.190
-4.577 (-0.93%)收盤時
Ameriprise Financial, Inc. is a diversified financial services company. The Company’s segments include Advice & Wealth Management, Asset Management, Retirement & Protection Solutions and Corporate & Other. The Advice & Wealth Management segment provides financial planning and advice, as well as full-service brokerage services, primarily to retail clients through the Company’s advisors. The Asset Management segment provides investment management, advice and products to retail, high net worth and institutional clients on a global scale through the Columbia Threadneedle Investments brand. It provides institutional products and services through its institutional sales force. The Retirement & Protection Solutions segment includes retirement solutions (variable annuities and payout annuities) and protection solutions (life and disability income insurance). Retirement Solutions provides variable annuity products by RiverSource Life companies to individual clients.
Currently, Ameriprise Financial Inc (AMP) is not a strong buy due to its recent downgrade by Bank of America, which caused a nearly 4% drop in stock price, now at $492.19. The stock's RSI is at 46.71, indicating it is nearing oversold territory, but not yet a clear buy signal. Additionally, the forward P/E ratio is 9.76, suggesting it is undervalued compared to its earnings potential, but the market sentiment remains cautious due to broader economic concerns and recent downgrades. The main risk is the potential for further declines if upcoming earnings do not meet expectations, especially after a disappointing earnings season for other major companies.
Morgan Stanley
$483
2026-10-09
Morgan Stanley
2026-10-09
目標價
$483
Evercore ISI
$632
2026-10-07
Evercore ISI
2026-10-07
目標價
$632
BMO Capital
$520
2026-10-06
BMO Capital
2026-10-06
目標價
$520
BofA
$570
2026-10-05
BofA
2026-10-05
目標價
$570
Raymond James
$638
2026-08-21
Raymond James
2026-08-21
目標價
$638
情境價格取自當年最後一個月度預測區間。機率為固定的模型權重(25 / 50 / 25),不構成保證。
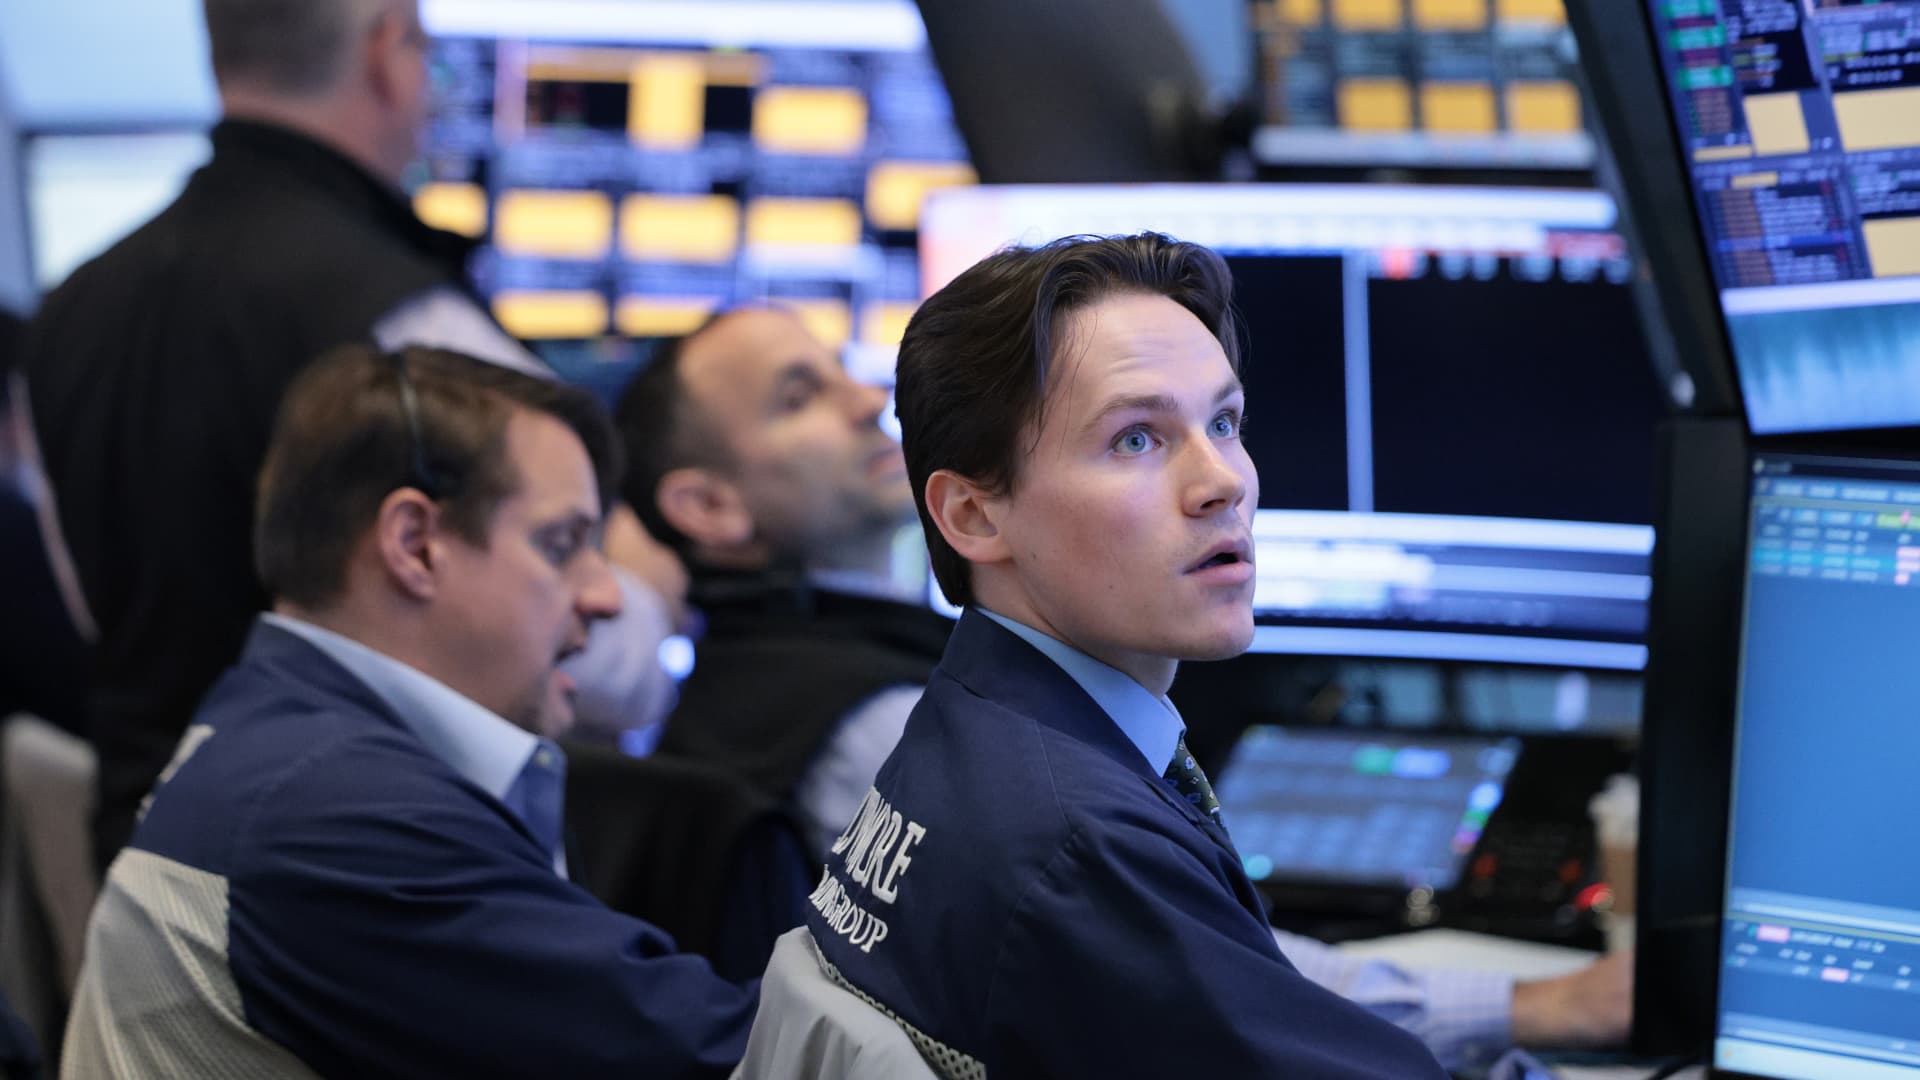
Major Risks Loom for Stock Market Next Week Amid AI Trade Stumbles
Bank of America Downgrades Ameriprise, Stock Drops Nearly 4%
Three Financial Advisor Teams Join Ameriprise Financial
Ameriprise Financial Named One of America's Best Companies for 2026

Ameriprise Financial Named One of America's Greatest Workplaces for 2026
Ameriprise Financial, Inc. is a diversified financial services company. The Company’s segments include Advice & Wealth Management, Asset Management, Retirement & Protection Solutions and Corporate & Other. The Advice & Wealth Management segment provides financial planning and advice, as well as full-service brokerage services, primarily to retail clients through the Company’s advisors. The Asset Management segment provides investment management, advice and products to retail, high net worth and institutional clients on a global scale through the Columbia Threadneedle Investments brand. It provides institutional products and services through its institutional sales force. The Retirement & Protection Solutions segment includes retirement solutions (variable annuities and payout annuities) and protection solutions (life and disability income insurance). Retirement Solutions provides variable annuity products by RiverSource Life companies to individual clients. It operates in the Financials sector (INVESTMENT ADVICE industry).
Currently, Ameriprise Financial Inc (AMP) is not a strong buy due to its recent downgrade by Bank of America, which caused a nearly 4% drop in stock price, now at $492.19. The stock's RSI is at 46.71, indicating it is nearing oversold territory, but not yet a clear buy signal. Additionally, the forward P/E ratio is 9.76, suggesting it is undervalued compared to its earnings potential, but the market sentiment remains cautious due to broader economic concerns and recent downgrades. The main risk is the potential for further declines if upcoming earnings do not meet expectations, especially after a disappointing earnings season for other major companies.
11 analysts cover AMP: 6 rate it Buy, 5 Hold and 0 Sell. The average price target is 559.71.

$OSMO $AMP $GTC Strongly broke above 83K! How are those bears doing? Bitcoin is really strong this time, pushing straight through $83,000! Just a few days ago it was lingering around the 80K mark, and many thought it was topping out. Then today a big green candle completely reversed the picture. The logic is clear: once the 80K psychological support was taken out, the earlier short positioning flipped almost instantly and became fuel for the move higher, pushing price up directly. Now the ceiling is fully open and market sentiment has been reignited. Once a move starts, capital rotation patterns tend to show up. Assets that have consolidated long enough at the bottom, with widely distributed holdings and solid consensus, naturally come back into focus. In times like these, it's even more important to hold onto things with real building behind them and not get shaken out easily. On this break above 83K, did you catch the move or miss it? (GTCUSDT) (AMPUSDT) (OSMOUSDT) #BitcoinBreaks83K #BitcoinBackAbove82K
展開
$AMP is at 0.000806. The nearest resistance above, the Bollinger upper band at 0.000773, has already been broken. The level really worth watching is the psychological zone around 0.00085. On the downside, the first support is MA5 at 0.000745, and the second support is MA20 at 0.000690. First, the method: to judge whether a rally is healthy, look at only two things — moving average alignment and where RSI sits. When MA5 is above MA20 and both are rising together, it means short- and medium-term costs are both moving up, and the trend structure is intact. But RSI at 81.7 has entered overbought territory, meaning the risk-reward of chasing higher is getting worse. The right move here is not to guess the top, but to wait for a pullback confirmation: if price falls back near MA5 and stabilizes, and the MACD histogram is still positive, that is a second entry point; if it breaks directly below MA20, the trend weakens and the bullish case is invalidated. $AMP currently has MA5 = 0.0007452 above MA20 = 0.0006895, the MACD histogram at +1.412e-05 remains bullish, 24h gain is 21.57%, and the 30-candle range is 26.18%, a typical high-volatility breakout pattern. The Fear & Greed Index at 63 is in greed territory — sentiment is warm but not extreme — and with the Bollinger upper band broken, there may still be short-term momentum. In terms of action, a pullback long is preferred over chasing highs. Entry reference: 0.000740–0.000760 (near MA5); take-profit 1 at 0.000850 (prior high extension), take-profit 2 at 0.000920 (measured move by equal range); stop-loss at 0.000680 (below MA20; a break below means the structure is broken). Also watch: $DOG and $ZK. Both are below MA5 with bearish MACD, clearly weaker than $AMP, suggesting funds are more concentrated in the stronger names. (Personal view only, for reference, not investment advice. Futures risk is extremely high, please strictly control position size.) [Data] Pair: AMPUSDT Direction: Long Entry: 0.000740-0.000760 Take-profit 1: 0.000850 Take-profit 2: 0.000920 Stop-loss: 0.000680
展開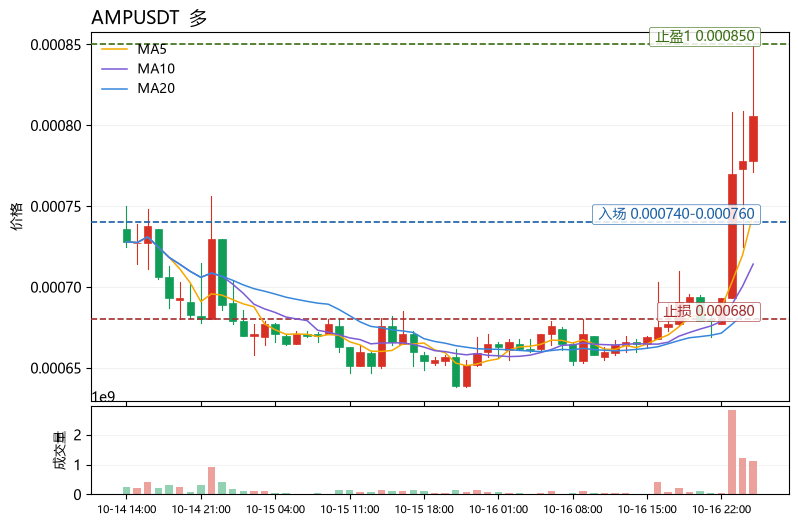

$AMP-USD · 1D This cup and handle pattern is progressing well so far. Please excuse the somewhat uneven curves, but you get the idea :) Amp is ready to move.
展開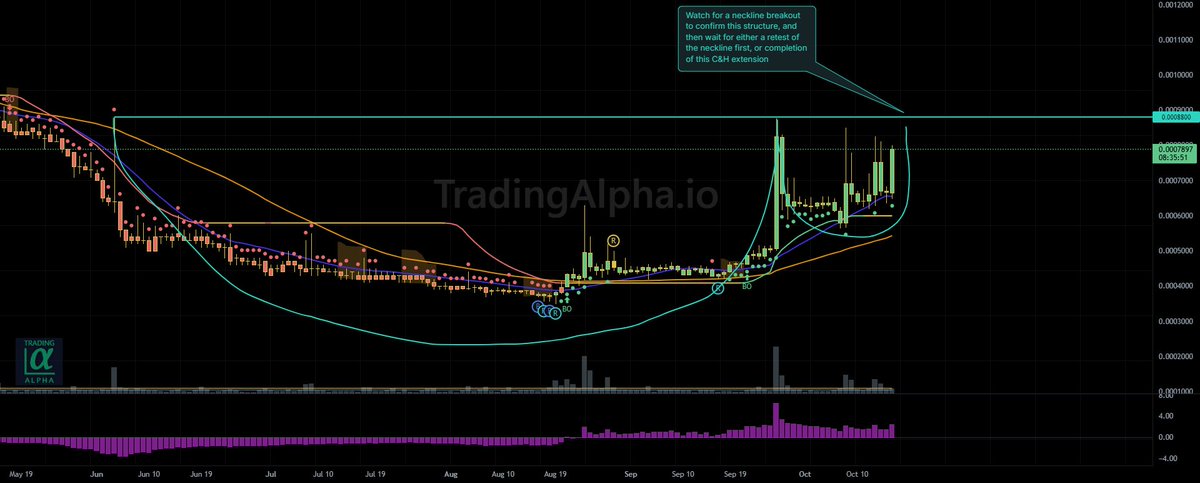


$XRP is currently at 1.3698. The bias is slightly long, but I will only buy dips within the range and not chase highs. Reasons: MA5=1.36984 is slightly above MA20=1.36891, the moving averages are compressed, and the MACD histogram at +0.001538 remains bullish, but RSI is only 49.6, so momentum is neutral; Bollinger Bands have narrowed to 1.35786-1.37996, and the 30-candle range is only 5.23%, indicating a low-volatility compression state. The real risk point is: the funding rate is -0.0056%, shorts are paying, which shows longs are not crowded, but the greed index at 57 means market sentiment is somewhat hot. Once price breaks below the lower Bollinger Band on volume, the downside expansion after compression could be very damaging. Position sizing suggestion: no more than 5% of total capital, leverage within 3x. Entry reference 1.362-1.370 (near MA20 and the middle Bollinger Band); take-profit 1 at 1.380 (upper Bollinger Band, resistance level); take-profit 2 at 1.395 (measured target after breaking above the upper band); stop-loss at 1.354 (after breaking below the lower Bollinger Band at 1.35786 and confirming, viewed as a range breakdown). Exit signal: if the 4-hour close loses 1.354 and the MACD histogram turns negative, exit regardless of profit or loss; if price spikes to 1.380 but RSI does not exceed 60, treat it as a false breakout and actively cut the position by half. Worst-case scenario: after low-volatility compression, price chooses a downward direction, and combined with fading greedy sentiment, it may quickly retrace to the 1.34 area. At that point, stop-loss discipline is the only defense; do not hold a losing position hoping for a rebound. Also watch: $AMP and $ZK have risen 13.25% and 11.84% respectively, with relative strength clearly stronger than $XRP, but their ranges are as high as 28.69% and 21.34%, so volatility risk is far higher than major coins. They are only for observation, not for heavy positions. (Personal view, for reference only, not any investment advice. Contract risk is extremely high, please strictly control position size.) [Data] Symbol: XRPUSDT Direction: Long Entry: 1.362-1.370 Take-profit 1: 1.380 Take-profit 2: 1.395 Stop-loss: 1.354
展開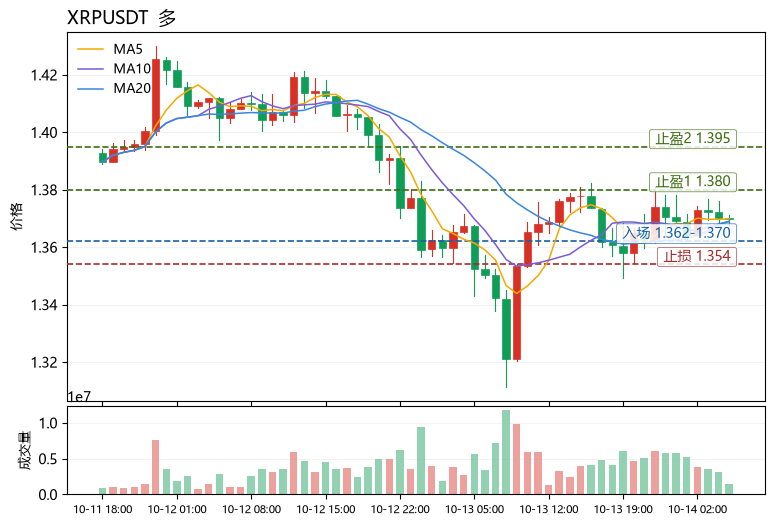
本頁僅供研究參考,不構成投資建議。模型可能出錯。過往表現不代表未來結果。