乐
乐观
乐观 · 25%TXN
$240.46
情景价格
$276.480
-2.627 (-0.95%)收盘时
Texas Instruments Incorporated is engaged in the design and manufacture of semiconductors. The Company operates through two segments, which include Analog and Embedded Processing. Its Analog segment semiconductors are used to manage power in all electronic equipment by converting, distributing, storing, discharging, isolating, and measuring electrical energy. It consists of two products, which include Power and Signal Chain. The Analog segment includes product lines, such as Power and Signal Chain. Power includes products that help customers manage power in electronic systems. Signal Chain products include amplifiers, data converters, interface products, motor drives, clocks, logic, and sensing products. Its portfolio is designed to manage power requirements across different voltage levels. The Embedded Processing segment products are designed to handle specific tasks and can be optimized for various combinations of performance, power, and cost, depending on the application.
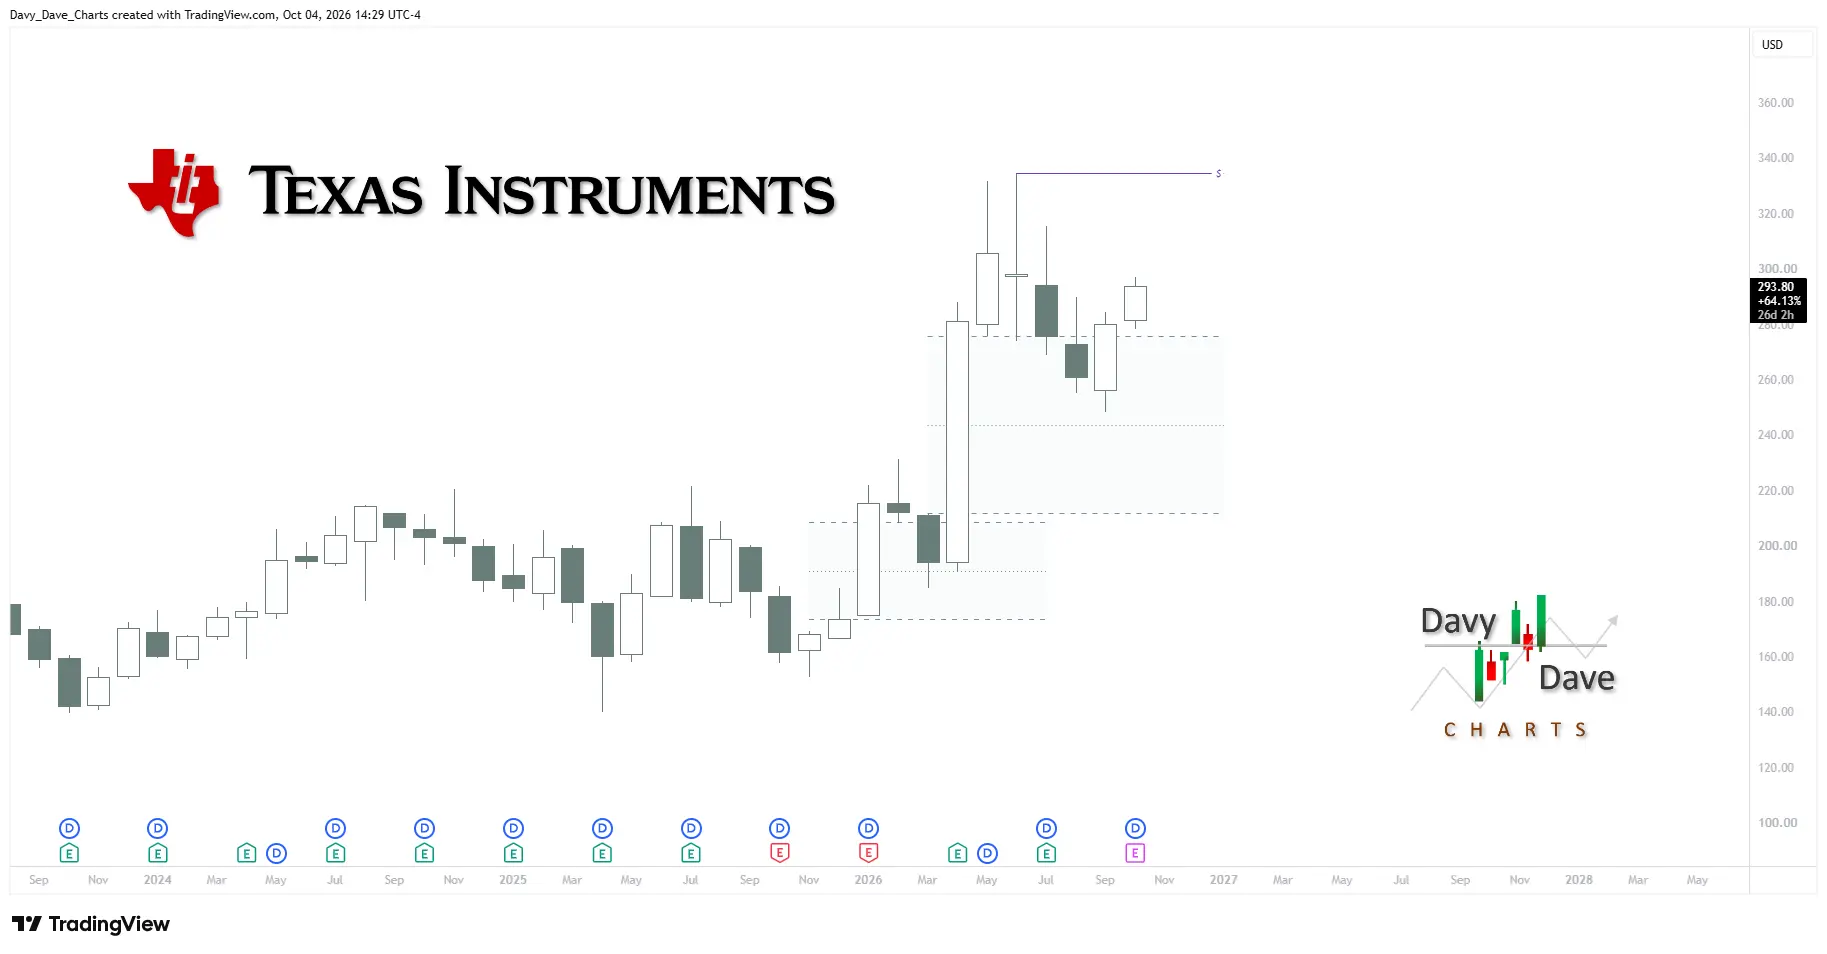
Texas Instruments Inc is currently a hold. The stock is trading at $276.48, with a forward P/E of 27.55, suggesting it may be overvalued compared to its growth prospects. The RSI is at 34.82, indicating it is nearing oversold territory, but the recent 5-day change is a decline of 2.56%, reflecting bearish sentiment in the market. The upcoming earnings report on October 21, 2026, could be a catalyst for movement, but caution is advised due to current market conditions and the potential for a 5% pullback by year-end as predicted by analysts. The main risk is the recent market sell-off, with the S&P 500 down 1.11% in the last day and 1.97% over the last 5 days.
Arete
$405
2026-07-29
Arete
2026-07-29
目标价
$405
Rosenblatt
$350
2026-07-24
Rosenblatt
2026-07-24
目标价
$350
UBS
$380
2026-07-23
UBS
2026-07-23
目标价
$380
Benchmark
$360
2026-07-23
Benchmark
2026-07-23
目标价
$360
TD Cowen
$340
2026-07-23
TD Cowen
2026-07-23
目标价
$340
情景价格取自当年最后一个月度预测区间。概率为固定的模型权重(25 / 50 / 25),不构成保证。

Upcoming Earnings Reports Spark Market Attention

Strong Outlook for Q3 Earnings Season Amid Market Caution

Wall Street Experiences Sell-Off on Friday

Software Sector Recovery and Investor Confidence

Texas Instruments Declares Quarterly Cash Dividend
Texas Instruments Incorporated is engaged in the design and manufacture of semiconductors. The Company operates through two segments, which include Analog and Embedded Processing. Its Analog segment semiconductors are used to manage power in all electronic equipment by converting, distributing, storing, discharging, isolating, and measuring electrical energy. It consists of two products, which include Power and Signal Chain. The Analog segment includes product lines, such as Power and Signal Chain. Power includes products that help customers manage power in electronic systems. Signal Chain products include amplifiers, data converters, interface products, motor drives, clocks, logic, and sensing products. Its portfolio is designed to manage power requirements across different voltage levels. The Embedded Processing segment products are designed to handle specific tasks and can be optimized for various combinations of performance, power, and cost, depending on the application. It operates in the Technology sector (SEMICONDUCTORS & RELATED DEVICES industry).
Texas Instruments Inc is currently a hold. The stock is trading at $276.48, with a forward P/E of 27.55, suggesting it may be overvalued compared to its growth prospects. The RSI is at 34.82, indicating it is nearing oversold territory, but the recent 5-day change is a decline of 2.56%, reflecting bearish sentiment in the market. The upcoming earnings report on October 21, 2026, could be a catalyst for movement, but caution is advised due to current market conditions and the potential for a 5% pullback by year-end as predicted by analysts. The main risk is the recent market sell-off, with the S&P 500 down 1.11% in the last day and 1.97% over the last 5 days.
32 analysts cover TXN: 14 rate it Buy, 17 Hold and 1 Sell. The average price target is 193.53.

本页仅供研究参考,不构成投资建议。模型可能出错。过往表现不代表未来结果。