乐
乐观
乐观 · 25%SEI
$35.41
情景价格
$58.740
+0.129 (+0.22%)收盘时
Solaris Energy Infrastructure, Inc. delivers comprehensive power infrastructure solutions including generation, distribution, installation and commissioning, aftermarket support, and operations and maintenance. Its segments include Solaris Power Solutions and Solaris Logistics Solutions. Solaris Power Solutions segment delivers power generation, power control, and power distribution solutions. The segment’s offerings support data center, energy, and other commercial and industrial sector customers by providing flexible, on-demand power infrastructure, including power control and distribution capabilities. Solaris Logistics Solutions segment designs and manufactures specialized equipment that enables the efficient management of raw materials used in the completion of oil and natural gas wells. The Company also offers specialized engineering, procurement and construction capabilities in heavy civil construction across multiple end markets, including large-scale data centers.
Solaris Energy Infrastructure Inc (SEI) is a good buy right now due to its current price of $58.74, which is well below the average analyst price target of $100, suggesting a potential upside of 70%. Additionally, the gross margin has improved to 39.54% in Q2 2026, indicating strong operational efficiency. However, the main risk is the high forward P/E ratio of 384.62, which suggests that the stock may be overvalued if growth expectations are not met.
情景价格取自当年最后一个月度预测区间。概率为固定的模型权重(25 / 50 / 25),不构成保证。
Solaris Energy Infrastructure's AI Buildout Unimpeded by Rising Interest Rates

Solaris Energy Infrastructure Prices $1.25 Billion Senior Notes Offering

Middle East Tensions Drive Oil Prices Higher

Solaris and Grace Executives Increase Stock Holdings

Solaris Energy Infrastructure Board Member Increases Shareholding
Solaris Energy Infrastructure, Inc. delivers comprehensive power infrastructure solutions including generation, distribution, installation and commissioning, aftermarket support, and operations and maintenance. Its segments include Solaris Power Solutions and Solaris Logistics Solutions. Solaris Power Solutions segment delivers power generation, power control, and power distribution solutions. The segment’s offerings support data center, energy, and other commercial and industrial sector customers by providing flexible, on-demand power infrastructure, including power control and distribution capabilities. Solaris Logistics Solutions segment designs and manufactures specialized equipment that enables the efficient management of raw materials used in the completion of oil and natural gas wells. The Company also offers specialized engineering, procurement and construction capabilities in heavy civil construction across multiple end markets, including large-scale data centers. It operates in the Energy sector.
Solaris Energy Infrastructure Inc (SEI) is a good buy right now due to its current price of $58.74, which is well below the average analyst price target of $100, suggesting a potential upside of 70%. Additionally, the gross margin has improved to 39.54% in Q2 2026, indicating strong operational efficiency. However, the main risk is the high forward P/E ratio of 384.62, which suggests that the stock may be overvalued if growth expectations are not met.

Five cents was capped at $SEI in July and August. September broke through that level with a 66% candle. Now October is testing the same level from above 🤝
展开
Gate 2026 Q3 Report: Building the Future of Finance Through Multi-Asset Innovation In my view, Gate's 2026 Q3 report highlights an important shift in the global financial industry. The future is no longer limited to crypto trading. Investors increasingly want access to digital assets, global stocks, ETFs, wealth management, tokenized stocks, and on-chain opportunities through one integrated platform. Gate is expanding into these areas while strengthening its trading infrastructure, liquidity, and financial services. 1. Strong Trading Performance and Global Competitiveness September delivered strong trading data, with derivatives volume reaching $396 billion, up 38.2% quarter over quarter; spot volume climbed to $48.8 billion, up 21.9%. These results place Gate among the top three centralized exchanges globally by derivatives volume. In August, CryptoQuant reported that Gate's 30-day spot volume grew 667%, the highest growth rate in the industry. 2. Global Stocks, ETFs, and Tokenized Stocks Gate expanded its offerings to more than 12,800 global stocks and ETFs across the US, Hong Kong, South Korea, and Japan. Coverage includes over 10,000 US stocks, 1,500 Hong Kong stocks, 1,000 South Korean stocks, and 300 Japanese stocks. Users can enjoy 24/7 access, fractional trading starting from as low as 0.01, and USDT settlement. The gStocks ecosystem is also gaining momentum, with August volume exceeding $2.5 billion, cumulative volume above $2 billion, and assets under management over $200 million. Gate also ranks among the top two global platforms in overall stock spot trading competitiveness. 3. Wealth Management and Passive Income Opportunities Simple Earn assets under management exceeded $1.85 billion, up more than 24% quarter over quarter. USDT holdings grew nearly 11%, with 85 additional assets offering flexible subscription options and 25 new fixed-term products launched. VIP fixed-term wealth management subscriptions exceeded 290 million USDT, with promotional USDT annualized yield reaching 11%. Gate Staking assets under management also exceeded $1.27 billion, up more than 57% from Q2. Other developments include new USD1 and SEI staking options, quarterly GUSD flexible US Treasury subscriptions reaching $257 million, and SOL staking reaching 662,500 SOL. 4. Product Innovation and Institutional Business Growth Quarterly ETF volume approached 60 billion USDT, with over 250,000 monthly active users and 424 trading pairs. Options volume grew 23.8% quarter over quarter, and new options users grew 52.1%. CrossEx quarterly volume grew 63%, retained assets grew 902%, and trading users grew about 315%. Meanwhile, RWA perpetual contracts reached a 9.1% market share, ranking third globally. 5. Security, Ecosystem Expansion, and Infrastructure Gate reported reserve assets of $8.215 billion in August, with an overall reserve ratio of 127%. Cumulative GT burn reached about 192 million tokens, reducing the initial supply by 63.98%. Pre-IPOs and IPO Access expanded investment opportunities, covering Moonshot AI (KIMI) and Jersey Mike's. Launchpool listed 17 projects, CandyDrop distributed about $2 million in rewards across 13 campaigns, and a single RLUSD campaign attracted over 80,000 participants. Idle Earn holdings exceeded $300 million and support USDT, USDC, and USD1. Gate Layer, Gate Card, and Gate.AI further strengthen the ecosystem through blockchain infrastructure, payments, and intelligent research. My Conclusion I believe Gate's Q3 performance shows how crypto exchanges can evolve into broader financial ecosystems. Trading growth, global stocks, automated yield products, institutional services, and transparency initiatives are jointly driving this transformation. With continued innovation and focus on user experience, Gate is positioning itself for the next stage of integrated digital finance. The key is to sustain this momentum while ensuring security, steady growth, and long-term user trust. #ShareWeekly #WCTCS9 #weeklyshare
展开


Sei has introduced SIP-5, a post-quantum migration plan aimed at protecting the network from potential future quantum and AI-driven cryptographic attacks. #SEI #Security $GATE
展开

$TIA is at 0.688, up 16.43% in 24h, with 42.1M USDT volume, funding rate -0.0020%, and Fear & Greed Index at 55. Price has moved above the Bollinger middle band at 0.6846, but MA5=0.6811 is still slightly below MA20=0.6846, and the MACD histogram at -0.004403 has not yet turned positive — a typical "price leads, indicators lag" structure. Here is a reusable chart-reading method: a moving average golden cross is not a buy point; the "direction" of the moving averages is. To judge whether a trend is healthy, look at three things: first, whether price can consistently close above MA20; second, whether MA5 turns from flat to upward; third, whether the MACD histogram narrows in sync. TIA currently meets only the first point, with the latter two still unconfirmed, so this is an "early reversal" rather than an "established trend." Combined with negative funding (shorts paying) and greedy sentiment, the short-term bias is toward the upside but requires light position sizing for trial entries. Entry reference 0.680–0.688 (the confluence zone of a pullback to MA5 and the Bollinger middle band); take-profit 1 at 0.712 (Bollinger upper band resistance); take-profit 2 at 0.735 (prior high extension); stop-loss at 0.656 (Bollinger lower band; a break below means the reversal has failed). RSI at 62.8 is not overbought, leaving room for further upside. Also watch: $TQQQ and $SEI. The former has RSI 23.1, severely oversold; the latter at 47.5 is neutral-to-weak. Both lag TIA in relative strength. (Personal views only, for reference, and not investment advice. Futures carry extremely high risk; please strictly control position sizing.) [Data] Pair: TIAUSDT Direction: Long Entry: 0.680-0.688 Take-profit 1: 0.712 Take-profit 2: 0.735 Stop-loss: 0.656
展开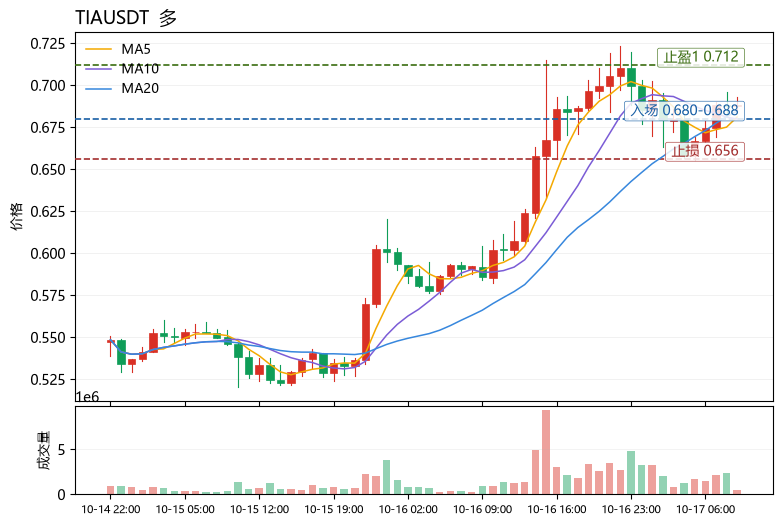
本页仅供研究参考,不构成投资建议。模型可能出错。过往表现不代表未来结果。