乐
乐观
乐观 · 25%MXL
$10.11
情景价格
$71.320
-6.255 (-8.77%)收盘时
MaxLinear, Inc. is a provider of radio frequency (RF), analog, digital and mixed-signal integrated circuits for access and connectivity, wired and wireless infrastructure, and industrial and multi-market applications. It is engaged in providing communications systems-on-chip (SoCs), used in broadband, mobile and wireline infrastructure, data center, and industrial and multi-market applications. Its customers include electronics distributors, module makers, original equipment manufacturers, and original design manufacturers, who incorporate its products in a range of electronic devices, such as radio transceivers and modems for 4G/5G base-station and backhaul infrastructure; optical transceivers targeting hyperscale data centers; Wi-Fi and wireline routers for home networking; broadband modems compliant with data over cable service interface specifications, passive optical fiber standards, and digital subscriber line; as well as power management and interface products used in markets.
Maxlinear Inc is currently not a strong buy due to its recent price drop and negative sentiment from insider selling, despite its potential in the AI sector. The current price is $71.32, with a 5-day change of -25.83%, indicating significant short-term volatility. However, the company has shown a remarkable year-to-date change of +285.31%, reflecting strong long-term growth potential. The main risk is the RSI at 19.827, indicating oversold conditions, which could lead to further price declines in the short term.
Susquehanna
$80
2026-07-24
Susquehanna
2026-07-24
目标价
$80
Stifel
$120
2026-07-24
Stifel
2026-07-24
目标价
$120
Needham
$100
2026-07-24
Needham
2026-07-24
目标价
$100
Roth Capital
$100
2026-07-23
Roth Capital
2026-07-23
目标价
$100
Wells Fargo
$75
2026-07-20
Wells Fargo
2026-07-20
目标价
$75
情景价格取自当年最后一个月度预测区间。概率为固定的模型权重(25 / 50 / 25),不构成保证。

MaxLinear Showcases AI-Ready Edge Gateway Solutions

Sandisk and MaxLinear: Investment Opportunities in the Semiconductor Sector

Three Tech Stocks Show Strong Growth Potential
MaxLinear Unveils Next-Gen 10G PON Gateway Chip Topaz
MaxLinear Shares Surge 50.7% in September Amid AI Demand
MaxLinear, Inc. is a provider of radio frequency (RF), analog, digital and mixed-signal integrated circuits for access and connectivity, wired and wireless infrastructure, and industrial and multi-market applications. It is engaged in providing communications systems-on-chip (SoCs), used in broadband, mobile and wireline infrastructure, data center, and industrial and multi-market applications. Its customers include electronics distributors, module makers, original equipment manufacturers, and original design manufacturers, who incorporate its products in a range of electronic devices, such as radio transceivers and modems for 4G/5G base-station and backhaul infrastructure; optical transceivers targeting hyperscale data centers; Wi-Fi and wireline routers for home networking; broadband modems compliant with data over cable service interface specifications, passive optical fiber standards, and digital subscriber line; as well as power management and interface products used in markets. It operates in the Technology sector (SEMICONDUCTORS & RELATED DEVICES industry).
Maxlinear Inc is currently not a strong buy due to its recent price drop and negative sentiment from insider selling, despite its potential in the AI sector. The current price is $71.32, with a 5-day change of -25.83%, indicating significant short-term volatility. However, the company has shown a remarkable year-to-date change of +285.31%, reflecting strong long-term growth potential. The main risk is the RSI at 19.827, indicating oversold conditions, which could lead to further price declines in the short term.
7 analysts cover MXL: 7 rate it Buy, 0 Hold and 0 Sell. The average price target is 20.83.

$MXL — the weekly lid just broke. Used to be broadband. Tape is pricing optical. Infrastructure is now the largest segment. Keystone PAM4 DSPs into hyperscale scale-up/out. Q2 $169M, +55%. Q3 guide $210–220M. Optical DC 2026 raised to $210–230M. One hyperscaler ramp can add $150–200M annualized. Cap $8.5B. SCTR 99.9. Next print Oct 21. Left $15 in April, tagged $128, four months under a falling line. Closed $93.84 (+16%) on 18M and punched through it. Pivot $81.60. Next $105 / $128. Measured move +96.5% toward $184–$192. Oscillator still washed out — broke the lid with momentum still red. $81 has to hold the first retest. Optical ramping. Lid gone. $81 is the line. $192 is the extension. NFA.
展开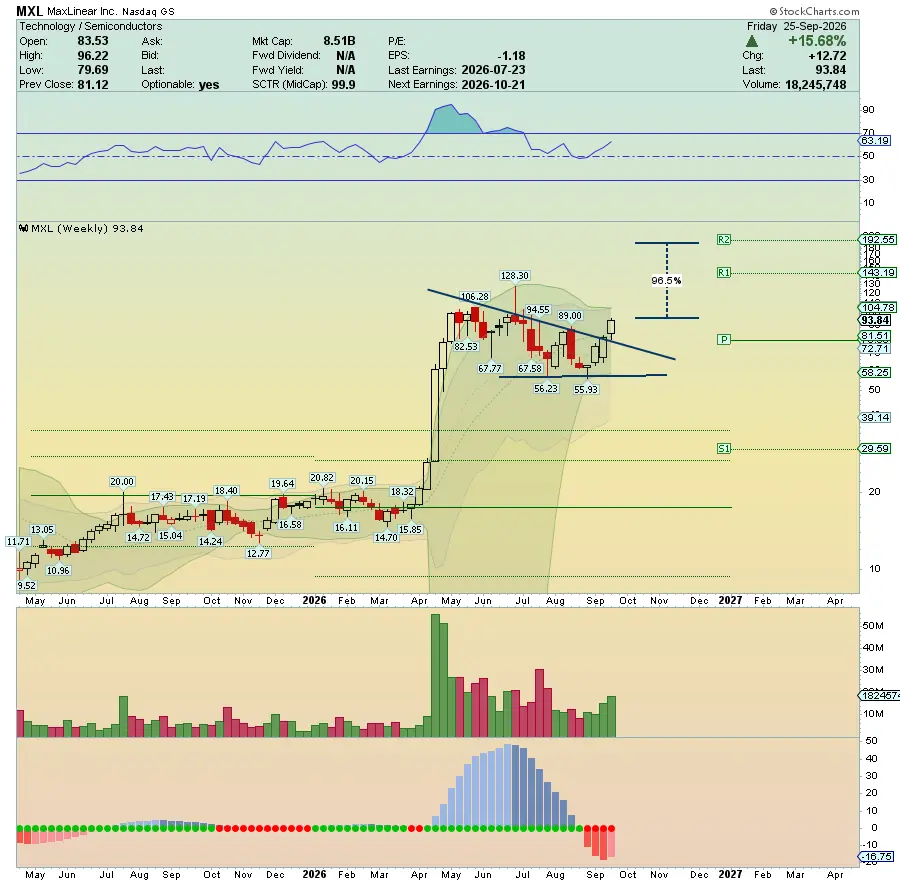

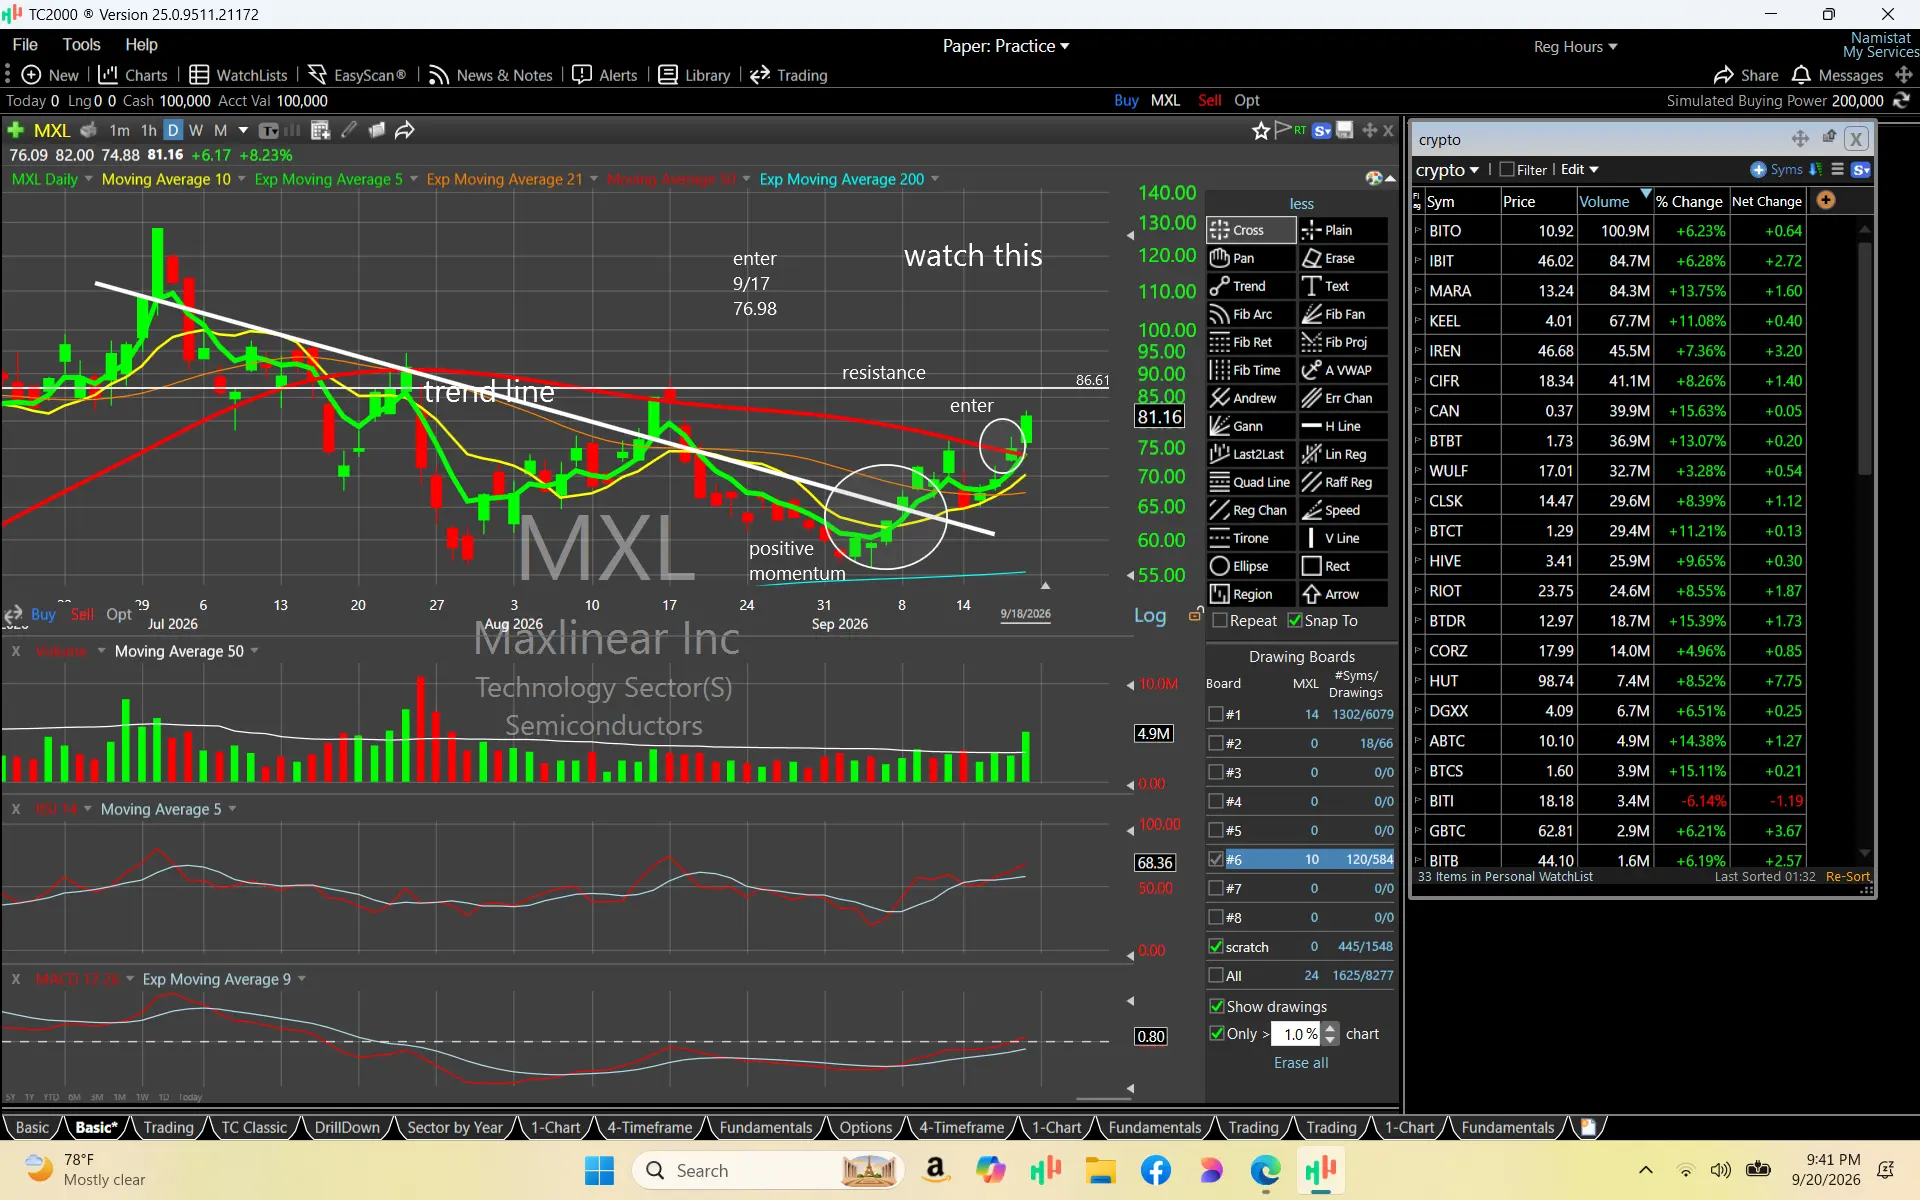
$MXL When this turned to positive momentum, it was too close to the 50-day (red line) to take a position, in my opinion, but once it gapped up on an open and touched the 50-day with a pop in volume, it was worth starting a position. Now that it cleared the 50-day with a 2x in volume, a probable uptrend is confirmed. If this opens positive Monday, it might be worth adding. The stop loss is under the 50-day.
展开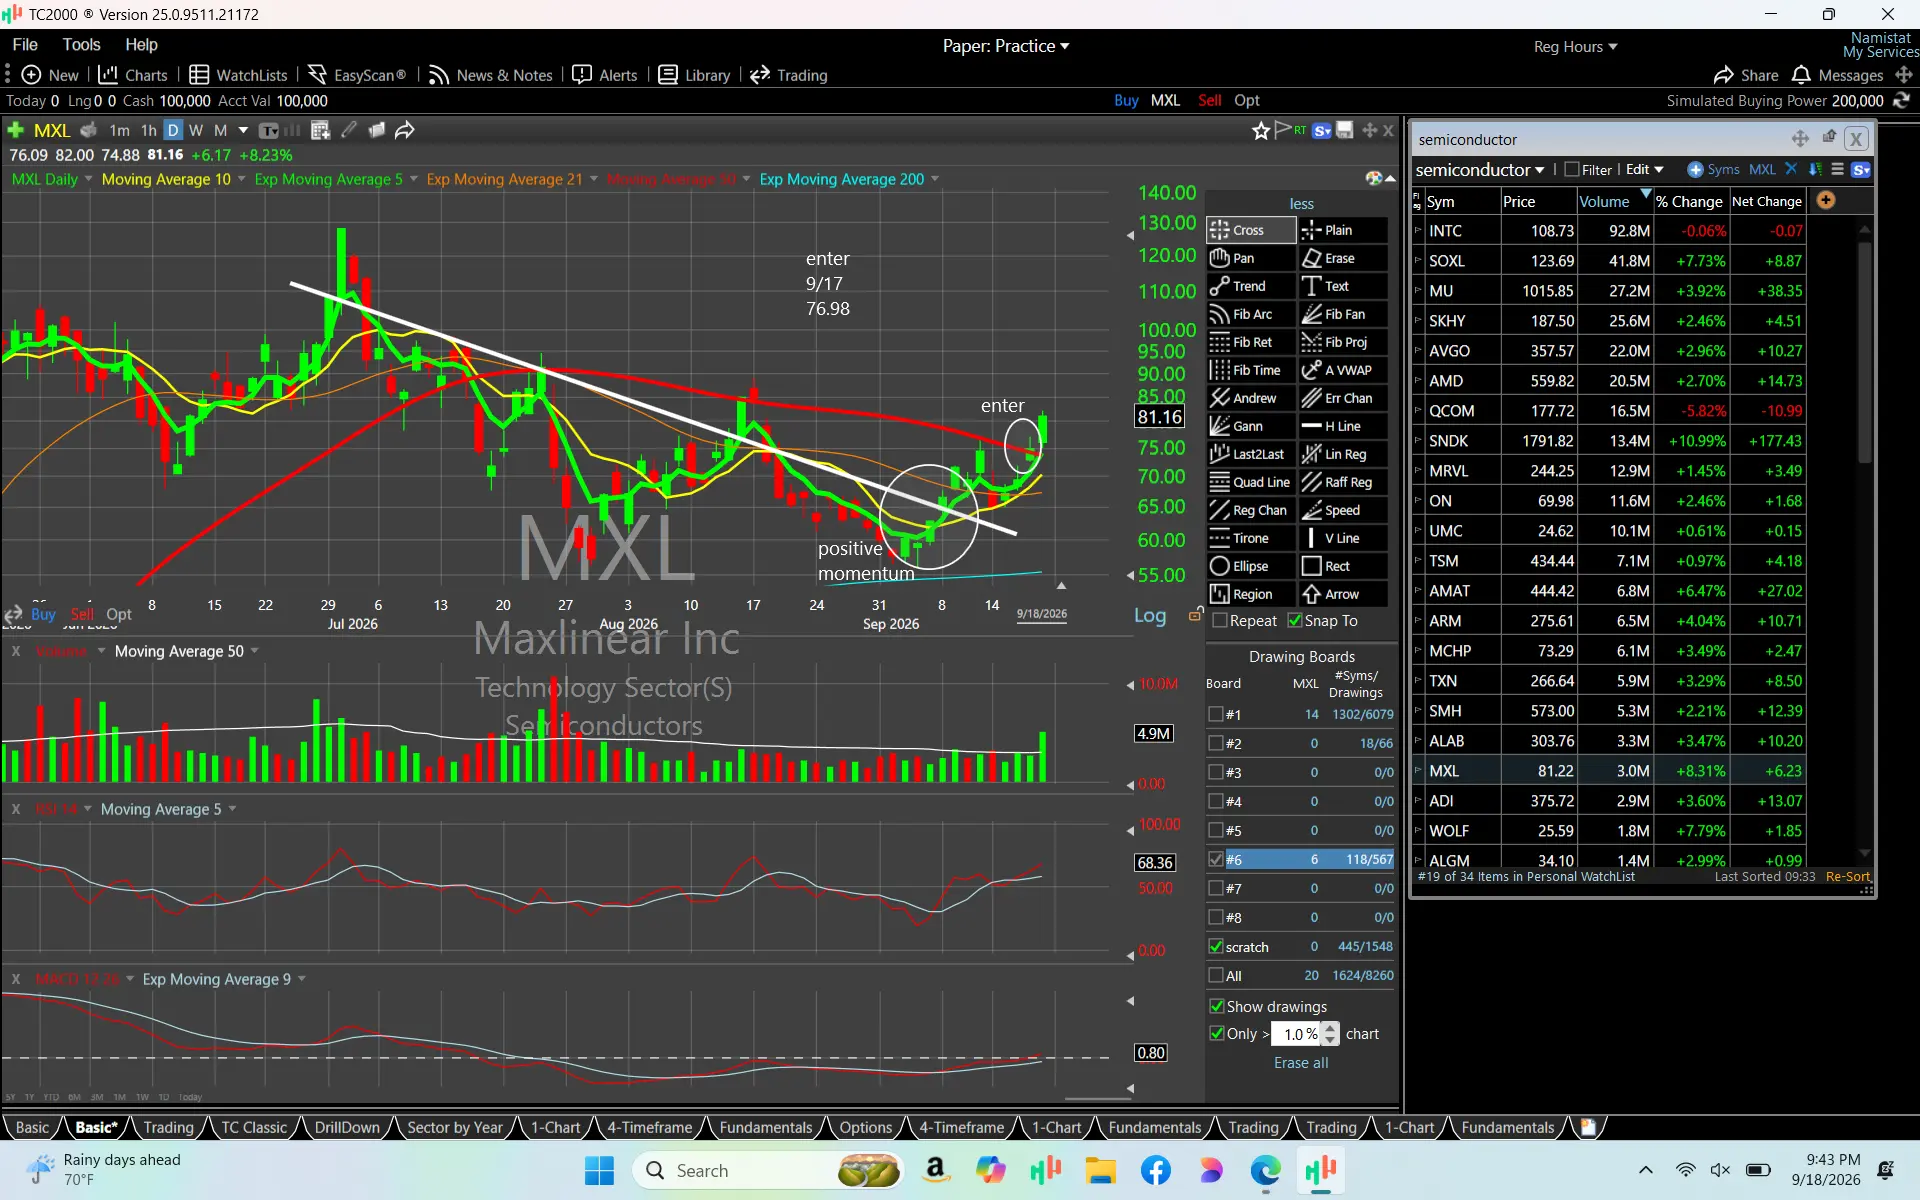
$MXL This is showing positive momentum with the 5-day EMA (green line) trending above the 10-day SMA (yellow line). The box on the upper left shows the close in green at 63.49. The high of the day matches the close at 63.49, which is a good sign. Friday opened with a gap up, which is favorable. If Tuesday opens positively, I may consider a small position, but cautiously, since both that trend line and the 21-day (orange line) are nearby. If I enter a small position and it moves above both of those lines, there is room toward the 50-day (red line). Nothing is guaranteed, but that is where I would watch for a potential setup.
展开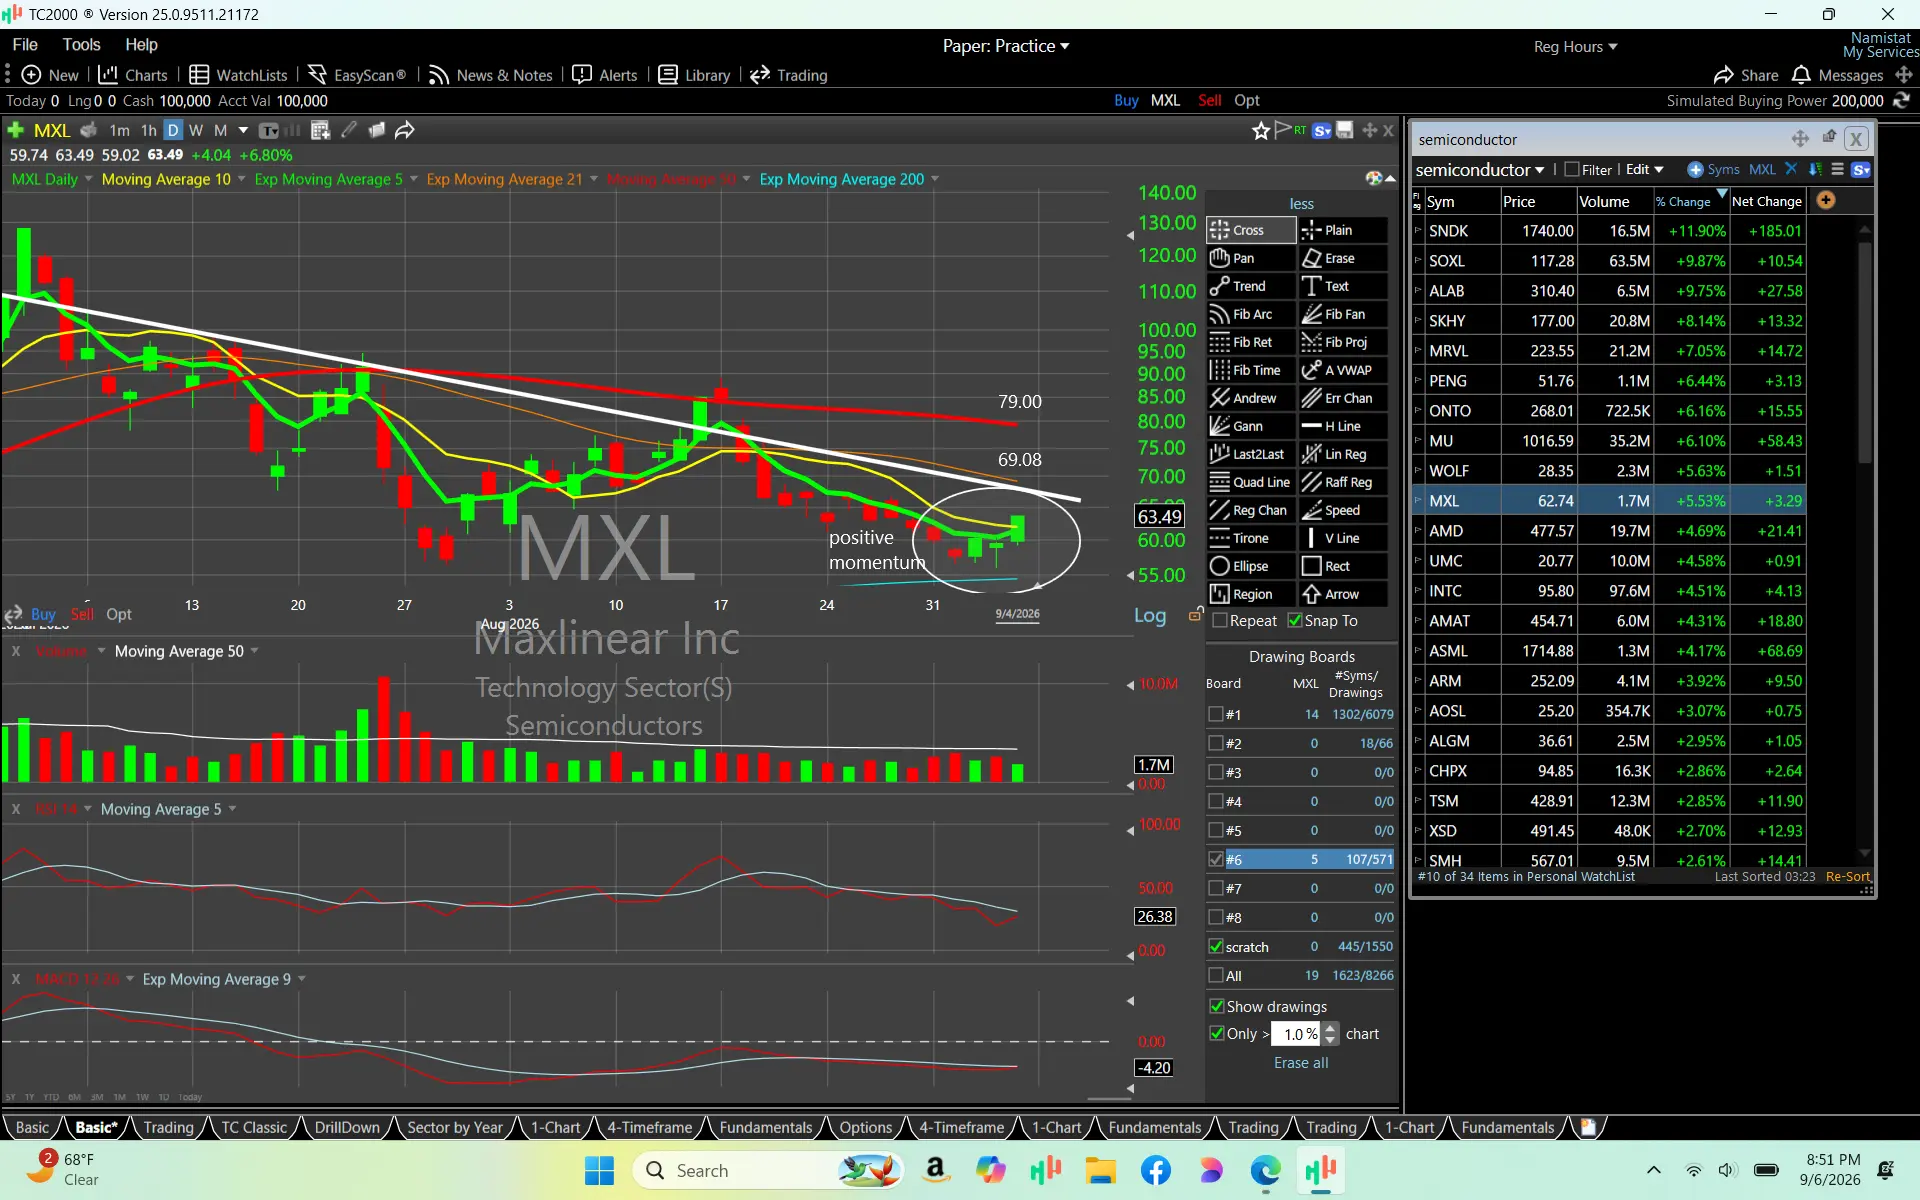
本页仅供研究参考,不构成投资建议。模型可能出错。过往表现不代表未来结果。