
乐
乐观
乐观 · 25%HEI
$396.96
情景价格
$309.870
+1.239 (+0.40%)收盘时
HEICO Corporation is a manufacturer of jet engine and aircraft component replacement parts. Its segments include the Flight Support Group (FSG) and the Electronic Technologies Group (ETG). The FSG segment consists of HEICO Aerospace Holdings Corp. and HEICO Flight Support Corp. (HFSC) and their subsidiaries. The FSG uses proprietary technology to design and manufacture jet engines and aircraft component replacement parts. FSG repairs, overhauls and distributes jet engine and aircraft components, avionics and instruments for domestic and foreign commercial air carriers and aircraft repair companies, as well as military and business aircraft operators. The ETG segment consists of HEICO Electronic Technologies Corp. and its subsidiaries. ETG designs, manufactures and sells various types of electronic, data and microwave, and electro-optical products, including infrared simulation and test equipment, laser rangefinder receivers, electrical power supplies, and others.
HEICO Corp is currently not a strong buy due to its recent price decline and cautious outlook in the aerospace sector. The current price is $298.28, with a low RSI of 39.134 indicating potential oversold conditions. However, the forward P/E ratio of 42.5532 suggests the stock may be overvalued at this price level. The main risk is the downgrade in price targets from analysts, with Melius Research lowering their target to $350, reflecting concerns about slowing growth in the aerospace aftermarket.
TD Cowen
$330
2026-10-09
TD Cowen
2026-10-09
目标价
$330
Guggenheim
—
2026-09-15
Guggenheim
2026-09-15
目标价
—
Guggenheim
—
2026-09-14
Guggenheim
2026-09-14
目标价
—
Melius Research
$350
2026-09-14
Melius Research
2026-09-14
目标价
$350
Morgan Stanley
$365
2026-09-02
Morgan Stanley
2026-09-02
目标价
$365
情景价格取自当年最后一个月度预测区间。概率为固定的模型权重(25 / 50 / 25),不构成保证。
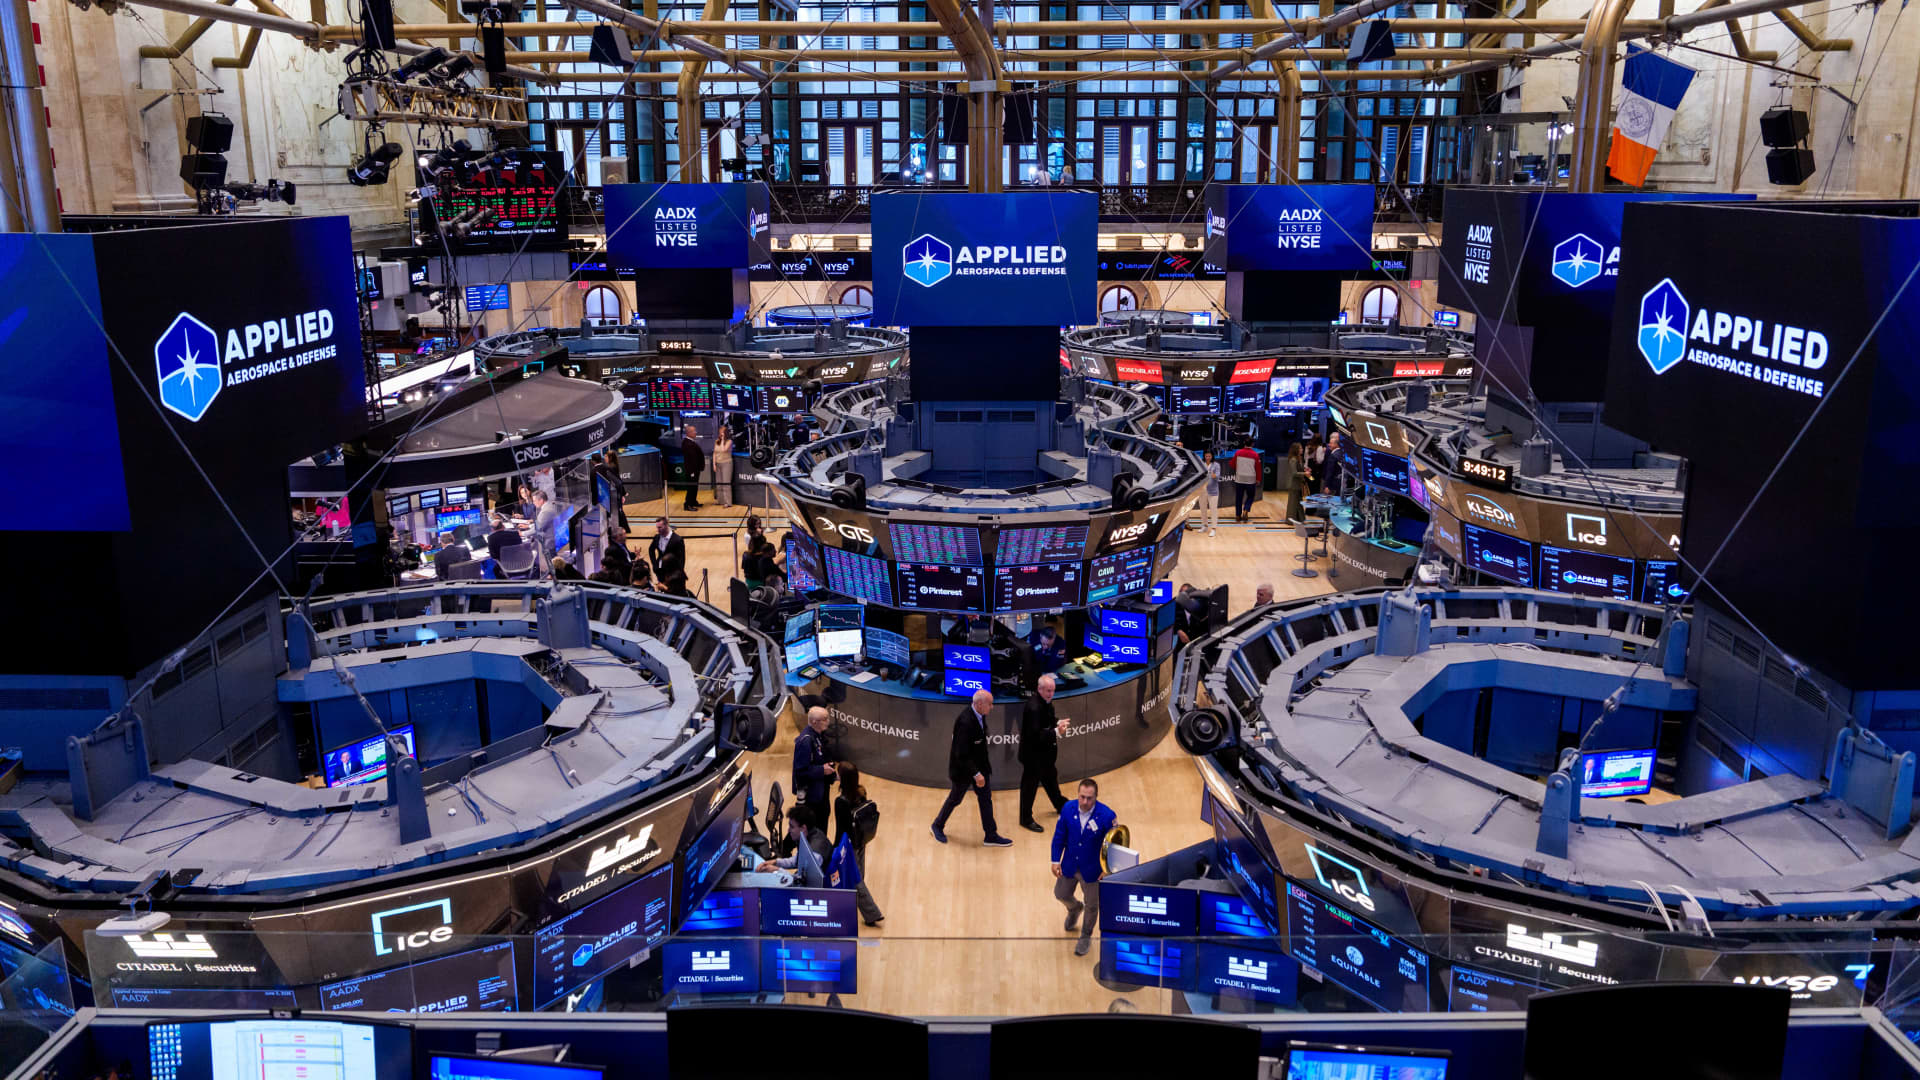
Applied Aerospace & Defense Shares Mispriced After Q2 Loss

Market Commentary: Insights from Fermi and HEICO

VPT Launches FLX Series Configurable DC-DC Converter for Mission-Critical Applications

Melius Warns of Slowing Aerospace Aftermarket Growth
Key Wall Street Rating Updates on Monday
HEICO Corporation is a manufacturer of jet engine and aircraft component replacement parts. Its segments include the Flight Support Group (FSG) and the Electronic Technologies Group (ETG). The FSG segment consists of HEICO Aerospace Holdings Corp. and HEICO Flight Support Corp. (HFSC) and their subsidiaries. The FSG uses proprietary technology to design and manufacture jet engines and aircraft component replacement parts. FSG repairs, overhauls and distributes jet engine and aircraft components, avionics and instruments for domestic and foreign commercial air carriers and aircraft repair companies, as well as military and business aircraft operators. The ETG segment consists of HEICO Electronic Technologies Corp. and its subsidiaries. ETG designs, manufactures and sells various types of electronic, data and microwave, and electro-optical products, including infrared simulation and test equipment, laser rangefinder receivers, electrical power supplies, and others. It operates in the Industrials sector (AIRCRAFT ENGINES & ENGINE PARTS industry).
HEICO Corp is currently not a strong buy due to its recent price decline and cautious outlook in the aerospace sector. The current price is $298.28, with a low RSI of 39.134 indicating potential oversold conditions. However, the forward P/E ratio of 42.5532 suggests the stock may be overvalued at this price level. The main risk is the downgrade in price targets from analysts, with Melius Research lowering their target to $350, reflecting concerns about slowing growth in the aerospace aftermarket.
10 analysts cover HEI: 6 rate it Buy, 4 Hold and 0 Sell. The average price target is 365.68.

October 3, 2026 | Crypto Analyst & Pro Trader Market Brief The market is giving us a mixed signal: Bitcoin remains the primary liquidity benchmark, Ethereum and major altcoins are facing pressure, while selected smaller-cap tokens are posting aggressive percentage gains. The real question is not simply which coin is moving up. It is whether the move has genuine volume, sustainable demand, and enough market participation to continue. Let's break down the Bitget market radar. 👇 ━━━━━━━━━━━━━━━━━━ 🚀 1. BITGET TOP GAINERS — MOMENTUM & VOLUME WATCH The latest available Bitget gainers snapshot highlights: 🟢 $DHN — Dohrnii: +1,796.83% 🟢 $AMI — Amnis Finance: +111.78% 🟢 $TEVA — Tevaera: +56.21% 🟢 $KABUTO — Kabuto King: +45.97% Additional notable trending performers include: 🟢 $BR — Bedrock: +167.58% 🟢 $DRV — Derive: +75.85% 🟢 $SYN — Synapse: +61.33% 🟢 $BULLA — Bulla: +51.94% 🟢 $LSK — Lisk: +29.86% 🟢 $ZEC — Zcash: +22.37% 🟢 $DGAI — DGrid AI: +20.28% 🟢 $DASH — Dash: +16.82% 🟢 $HNT — Helium: +14.93% 🟢 $HEI — Heima: +12.24% 🟢 $NEAR — NEAR Protocol: +12.16% 🟢 $VVV — Venice Token: +10.85% 🟢 $DOT — Polkadot: +6.93% 🟢 $HYPE — Hyperliquid: +1.95% Source: Bitget gainers and trending market pages. Some listed assets may not be available for trading on Bitget. Professional interpretation: The strongest percentage moves are concentrated in smaller-cap assets, while $ZEC, $NEAR, $DASH, and $LSK are attracting attention among the broader trending list. However, a massive percentage gain is not automatically a high-quality trading setup. Check liquidity, order-book depth, circulating supply, and whether volume is expanding alongside price. ━━━━━━━━━━━━━━━━━━ 🔻 2. BITGET TOP LOSERS — DOWNSIDE & RISK RADAR The available Bitget losers snapshot identifies the following downside performers: 🔴 $SILV — Dominion Silver: -74.93% 🔴 $MOW — MowCat: -48.26% 🔴 $TAKO — Tako: -40.64% 🔴 $CLAN — clan.tech: -37.60% 🔴 $XGP — XGP: -30.05% 🔴 $MICRODUCK — microduck: -31.21% 🔴 $HAROLD — Harold: -29.06% 🔴 $KABUTO — Kabuto King: -24.55% 🔴 $YNUSDX — ynUSD Max: -28.28% 🔴 $EGG — Goose Finance: -21.96% 🔴 $POOH — POOH: -25.44% 🔴 $B-MONEY — b-money: -27.53% 🔴 $RVN — Ravencoin: -23.89% 🔴 $BUILD — build: -22.95% 🔴 $KCT — Konnect: -23.28% 🔴 $WOOF — Shibinhood: -10.16% 🔴 $CATE — Catecoin: -23.69% 🔴 $CAPX — Capx AI: -20.44% 🔴 $HOLD — Everybody Holds: -20.40% These are the values displayed in Bitget's available losers snapshot, which may not reflect the latest live ranking. Trader's interpretation: When a token falls sharply despite previously strong weekly performance, the move may represent profit-taking, liquidity withdrawal, or a failed momentum breakout. Watch for lower highs, declining volume on rebounds, and support failures. Avoid treating an oversold reading as an automatic buy signal. ━━━━━━━━━━━━━━━━━━
展开
$COAI $HEI $SKYAI A Trading Mentor Worth Knowing Honestly, Craig deserves so much appreciation for the knowledge and dedication he brings to trading. His ability to break down market movements and explain things in a practical way is something I genuinely admire. What stands out most is his emphasis on discipline, patience, and understanding the risks before making decisions. His guidance has helped me appreciate trading from a different perspective. If you're looking to improve your understanding of the crypto market and develop better trading habits, I highly recommend checking out Craig's approach. I'm truly grateful for the lessons I've learned and the valuable insights he continues to share.
展开

🔥 Can XPL Hold $0.10332 After a 10% Drop? Technically, This Crypto Zone Matters $XPL 📊 Key Levels Resistance: $0.11335 Next level: $0.11553 Support: $0.10332 Near support: $0.10316 🕯️ Last Candle Insight XPL is trading around $0.10519, down 10.51%, with a 24h range of $0.10332 to $0.11791. Price is now sitting close to the key $0.10332 support, so the reaction here deserves attention. 📈 Bullish Scenario A candle close above $0.11335 followed by a hold could bring $0.11553 into focus. 📉 Pullback Risk If $0.10332 fails to hold, $0.10316 becomes the next level to watch. 📊 Volume Context 24h volume is 8.29M XPL, with $905.35K turnover. Trading activity remains notable while price is testing the lower end of the current range. 💡 Bottom Line XPL is under pressure after a 10.51% decline, but it is approaching an important support zone. Holding $0.10332 could be important for any recovery attempt. 🔍 Pro Tip: Don’t assume a bounce from support means a reversal. Watch $0.10332 closely, while a candle close and hold above $0.11335 would give stronger confirmation of recovery. For educational purposes only. DYOR. $Q $HEI
展开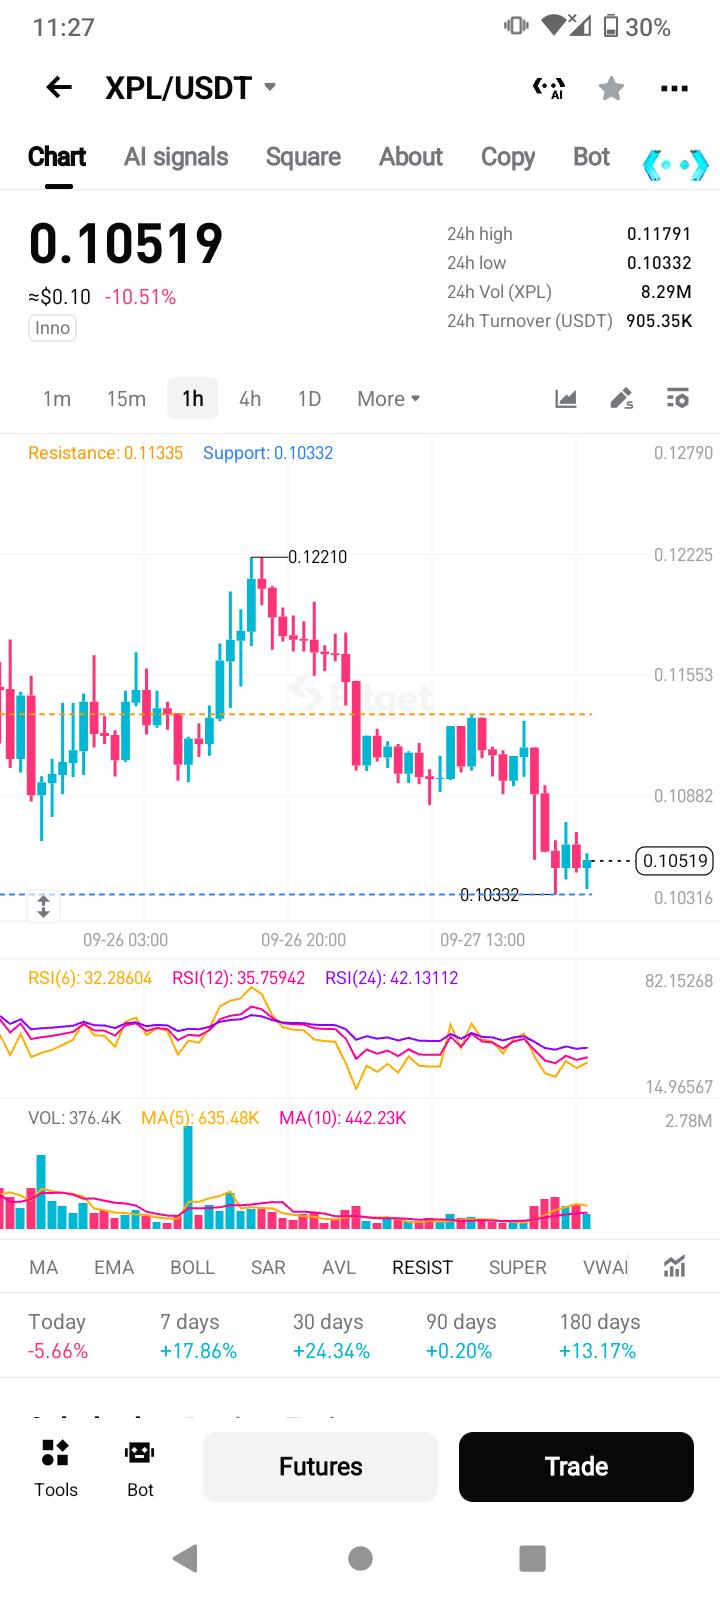

$HEI short-term bias is long, but this is a counter-trend bounce rather than a trend reversal, so chasing the high carries more risk than buying a pullback. The Fear & Greed Index is 71, putting the market in the greed zone. Risk appetite is still present, but BTC has not given a clear direction. ETH is only +0.22% over 24h, RSI 50.2, MACD bearish, and its correlation with the broader market is weak. This means HEI's 12% gain is more likely sector rotation than a systemic driver, and its sustainability needs to be watched. Technically, HEI at 0.1592 is still capped by MA20 (0.1635), MA5 has crossed below MA20, and the MACD histogram at -0.0013 remains bearish, so the medium-term structure has not yet repaired. However, RSI 53.8 is neutral-to-strong, the lower Bollinger Band at 0.1524 provides effective support, and the funding rate of +0.0050% shows mild long sentiment without overheating or a squeeze, so a pullback near the lower band offers value for a trade. For execution, I suggest scaling into longs on a pullback to the 0.1530-0.1560 range. This zone is close to the lower Bollinger Band and near the lower edge of the 30-candle range, offering a reasonable risk-reward ratio. Take-profit 1 is 0.1635 (MA20 resistance, also the current long-short dividing line). Take-profit 2 is 0.1745 (upper Bollinger Band, valid only after a volume breakout above MA20). Stop-loss is 0.1490. If price breaks below the lower Bollinger Band and loses the prior low structure, the thesis is invalid and I would exit decisively. Also watch: $ET and $EPIC. Both have similar 24h gains, but ETH has stronger volume and EPIC has greater elasticity. In relative strength, ETH is steadier and EPIC is more speculative. (Personal view only, for reference only, not any investment advice. Contract risk is extremely high, please strictly control position size.) [Data] Pair: HEIUSDT Direction: Long Entry: 0.1530-0.1560 Take-profit 1: 0.1635 Take-profit 2: 0.1745 Stop-loss: 0.1490
展开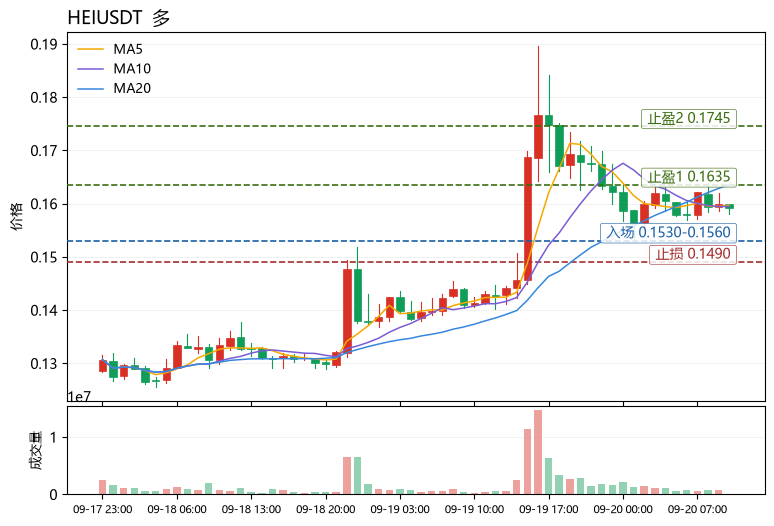
$XTZ stands out today: a 24h jump of 30.46%, yet the funding rate is -0.0510%. With price pushed up like this and the futures side still paying shorts, this looks like a spot-driven squeeze rather than leverage-fueled froth. Among its peers, this kind of structure is worth watching most. A cross-comparison: $HEI is up 16.34%, funding rate +0.0050%, longs are already paying, RSI 59.1; $DASH is down 3.07%, MA5 has fallen below MA20, RSI 41.6, clearly lagging. $XTZ has the largest gain, the lowest funding rate, and RSI 69.5 has not yet broken 80. Its relative strength ranks first, and it is not overheated to the point where it must be realized immediately. Technicals: MA5=0.36506 has crossed above MA20=0.34643, trend confirmed; the Bollinger upper band at 0.381661 is the nearest resistance, and the current price of 0.3688 is running right along the upper band. The only flaw is that the MACD histogram is still negative (-8.648e-05), meaning momentum lags price, which means chasing highs requires waiting for a pullback. Direction is bullish. Entry reference 0.3580-0.3660 (near the MA5 pullback, while also above the Bollinger middle band, for a better risk-reward ratio); take-profit 1 at 0.3815 (Bollinger upper band, first touch likely to see selling pressure); take-profit 2 at 0.4020 (measured extension after breaking the upper band); stop-loss at 0.3440 (a break below MA20=0.34643 means the trend structure is broken). The Fear & Greed Index at 71 is in the greed zone, so position size should not be too heavy. Also watch during the same period: $HEI and $DASH, the former relatively strong and the latter relatively weak, as reference for sector strength. (Personal view only, for reference only, not any investment advice. Futures risk is extremely high, please strictly control position size.) [Data] Coin: XTZUSDT Direction: Long Entry: 0.3580-0.3660 Take-profit 1: 0.3815 Take-profit 2: 0.4020 Stop-loss: 0.3440
展开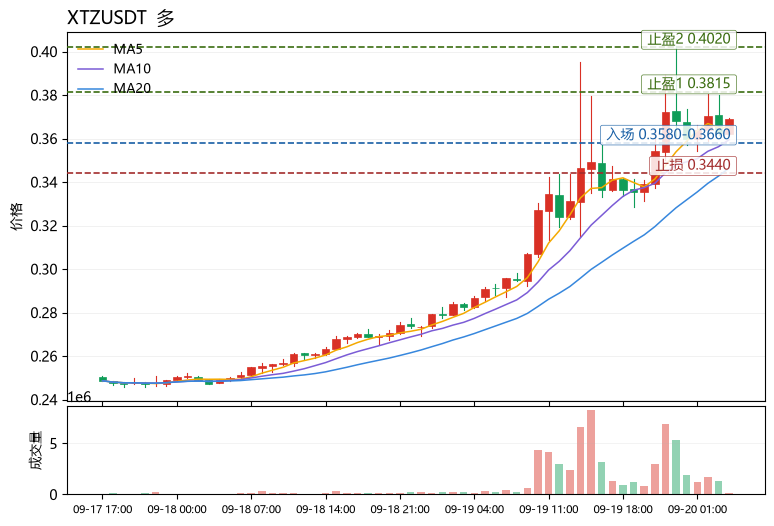
本页仅供研究参考,不构成投资建议。模型可能出错。过往表现不代表未来结果。