
乐
乐观
乐观 · 25%FET
$19.77
情景价格
$85.060
+6.873 (+8.08%)收盘时
Forum Energy Technologies, Inc. is a global manufacturing company serving the oil, natural gas, industrial and renewable energy industries. Its segments include Drilling and Completions, and Artificial Lift and Downhole. The Drilling and Completions segment designs, manufactures and supplies products and solutions to the drilling, subsea, coiled tubing, well stimulation and intervention markets, including applications in the oil and natural gas, renewable energy, defense and communications industries. The products and solutions include capital equipment and consumable products, wireline cable and pressure control equipment, and coiled tubing strings and pressure control equipment. The Artificial Lift and Downhole segment designs, manufactures and supplies products and solutions for the artificial lift, well construction, production and infrastructure markets. Its products include well construction casing and cementing equipment, customized downhole technology solutions, and others.
Forum Energy Technologies Inc is currently a hold. The stock's current price is 78.7, and it has shown a year-to-date change of +105.70%, indicating strong performance. However, the RSI is at 34.372, suggesting it is nearing oversold territory, which could lead to further price declines. The forward P/E of 15.06 indicates potential value, but the recent 5-day change of -6.98% raises concerns about short-term volatility.
情景价格取自当年最后一个月度预测区间。概率为固定的模型权重(25 / 50 / 25),不构成保证。

Forum Energy Technologies to Participate in Water Tower Research Virtual Conference
Forum Energy Technologies to Present at Investor Conference
Forum Energy Technologies CFO to Present at EnerCom Denver Conference

Forum Energy Technologies Reports Strong Q2 Earnings, Shares Surge

Forum Energy Technologies Reports Strong Q2 Earnings
Forum Energy Technologies, Inc. is a global manufacturing company serving the oil, natural gas, industrial and renewable energy industries. Its segments include Drilling and Completions, and Artificial Lift and Downhole. The Drilling and Completions segment designs, manufactures and supplies products and solutions to the drilling, subsea, coiled tubing, well stimulation and intervention markets, including applications in the oil and natural gas, renewable energy, defense and communications industries. The products and solutions include capital equipment and consumable products, wireline cable and pressure control equipment, and coiled tubing strings and pressure control equipment. The Artificial Lift and Downhole segment designs, manufactures and supplies products and solutions for the artificial lift, well construction, production and infrastructure markets. Its products include well construction casing and cementing equipment, customized downhole technology solutions, and others. It operates in the Energy sector (OIL & GAS FIELD MACHINERY & EQUIPMENT industry).
Forum Energy Technologies Inc is currently a hold. The stock's current price is 78.7, and it has shown a year-to-date change of +105.70%, indicating strong performance. However, the RSI is at 34.372, suggesting it is nearing oversold territory, which could lead to further price declines. The forward P/E of 15.06 indicates potential value, but the recent 5-day change of -6.98% raises concerns about short-term volatility.
20 analysts cover FET: 6 rate it Buy, 14 Hold and 0 Sell.

$ZRO is at 1.95, with resistance above at 2.00 and support below at 1.90, in a short-term oversold recovery window within a bearish structure. MA5=1.9506 remains below MA20=1.9993, and the bearish moving average alignment is unchanged, but price has pressed up against MA5, and downside momentum is slowing at the margin; the MACD histogram at -0.005299 remains negative, indicating a weak rebound rather than a reversal; RSI=37.3 is near the lower edge of the weak zone, and downside room is compressed; the lower Bollinger Band at 1.90029 is only a step away from the current price and forms the first support, while the middle band at 2.09831 is the natural resistance for a rebound. The funding rate of +0.0050% shows longs are still paying to hold positions, and with the Fear & Greed Index at 55 (Greed), shorting here is not attractive, so I lean toward playing a technical rebound near support. For action, I mainly favor buying low: entry reference 1.90–1.93, the confluence zone of the lower Bollinger Band and the round-number level, also close to the starting point of RSI oversold recovery; take-profit 1 at 2.00, corresponding to psychological resistance below MA20 and the moving-average mean-reversion level; take-profit 2 at 2.09, corresponding to the Bollinger middle band, also the last line of defense in the bearish structure; stop-loss at 1.86, exiting if price breaks below the lower Bollinger Band and confirms support failure, to avoid an accelerated downside move from moving averages. If price rebounds directly above 2.00 without sustained volume, I will give up chasing the long. Also watching: $ER +15.31% in 24h, RSI 83.8 already in overbought territory, relatively strong but with high risk in chasing; $FET RSI 30.2 is weak, lagging $ZRO's recovery pace. (Personal view, for reference only, and not investment advice. Futures risk is extremely high, so please strictly control position size.) Data: Pair: ZROUSDT Direction: Long Entry: 1.90-1.93 Take-profit 1: 2.00 Take-profit 2: 2.09 Stop-loss: 1.86
展开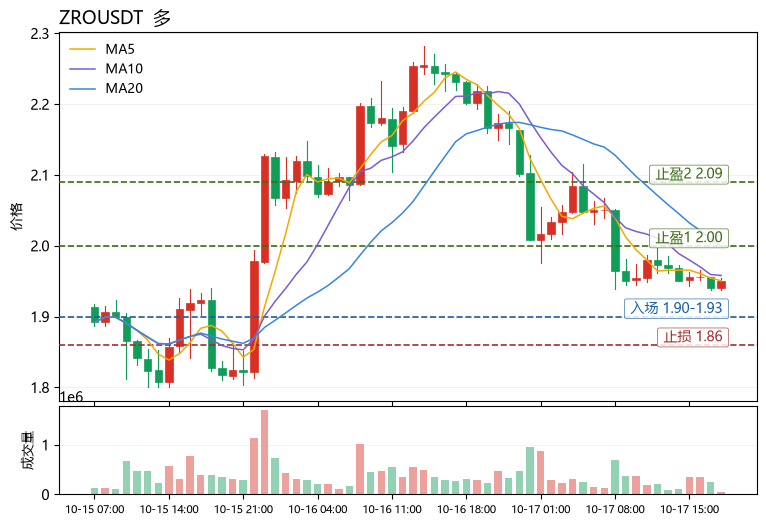

Interestingly, everyone likes how $FET performs above $3. But no one is willing to buy below $0.20. I think this is a coin worth watching closely. The real question is whether buyers will finally step in. $FET Dyor #TeslaQ3ProfitAndMargins
展开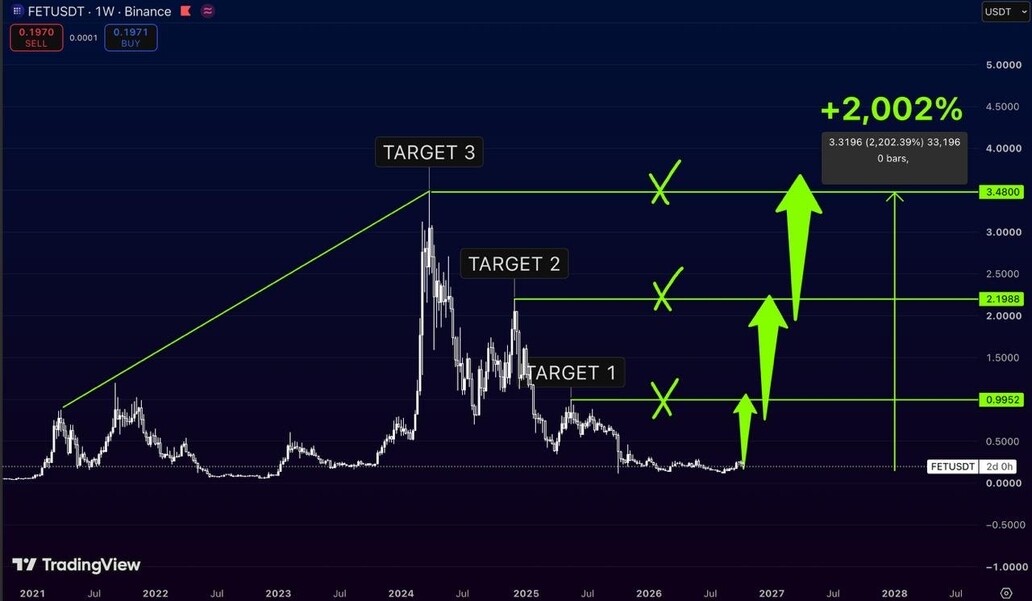

Ethereum: currently testing its 1D uptrend support and the major daily support zone at $0.18–0.20. As long as this range holds, $0.30–0.40 is the next target area. 📈 #FET #FETUSDT #FetchAi #Crypto #Alts
展开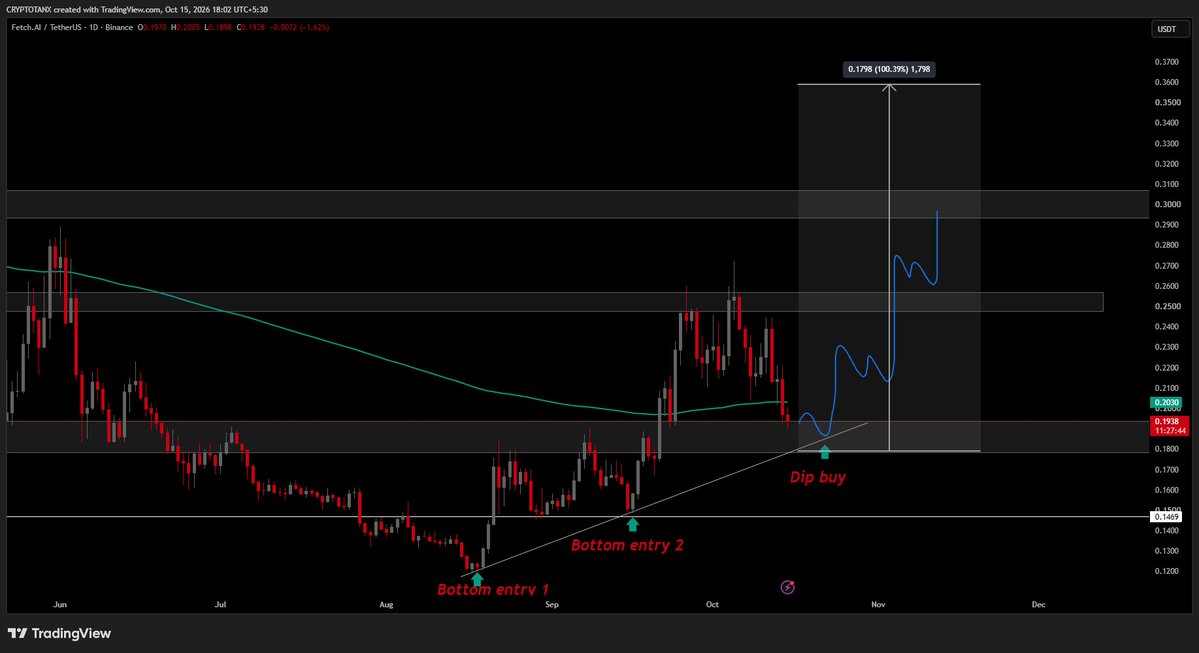

$FET looks directionally aligned, but the shrinking volume shows no real conviction. $FET is down 8.93% over 24 hours, now at 0.2152. Both the 1-hour and 4-hour structures lean weak, yet current volume is only 0.13x the average of the previous 20 candles. Direction is aligned, but participation has not followed, which is exactly the most debatable point right now. Volume is not backing the move: current 1-hour volume is only 0.13x the average of the previous 20 candles. Low volume can still move price quickly, but sustainability must be proven by the next leg. One touch or one long candle is not enough to draw a conclusion. Position is more honest than adjectives. The current price is about 6.27% from 1-hour support at 0.2017 and about 13.52% from resistance at 0.2443. Putting both distances together makes it clearer which side needs more evidence. Looking only at percentage change makes it easy to mistake space already traveled for space that has not yet begun. Set emotion aside first; the structure gives very specific information. The 1-hour EMA20 is at 0.21983351, currently weak; the 4-hour EMA20 is at 0.22475704, currently weak. Shorter timeframes expose changes, while larger timeframes limit imagination. When both align, guard against crowding; when they conflict, guard against repeated reversals. Do not only pick the side that suits you. The stronger side has a clear task: first hold above 1-hour resistance at 0.2443, then observe whether the area around 4-hour resistance at 0.2443 can still maintain follow-through. If price only briefly crosses above and quickly returns to the range, the so-called breakout lacks the most critical second half. The opposing side also has a clear invalidation line. A break below 1-hour support at 0.2017 means short-term follow-through failed the test; if 4-hour support at 0.2017 is further broken, the prior strong or repair judgment must be rewritten. A view can be maintained, but when the evidence changes, it cannot be ignored. This judgment will be reviewed against two conditions, not just screenshotted when the outcome happens to be right: whether price first handles 0.2443, and whether 0.2017 can hold on a pullback. The former answers whether there is follow-through above; the latter answers whether support is real. The next update will only check whether the conditions were met, without using a new story to excuse the old judgment. It is easier to understand this move as equipment acceptance testing: running under no load does not count as complete; only remaining stable under boundary conditions gives the conclusion weight. For now I am not betting on slogans, only waiting for price to walk the conditions out. From the opposing side, do you think directional alignment matters more, or will shrinking volume make this move quickly lose continuation? Market volatility is high; the above is only market observation and does not constitute investment advice. This is Niu Niu Shuo in the crypto space.
展开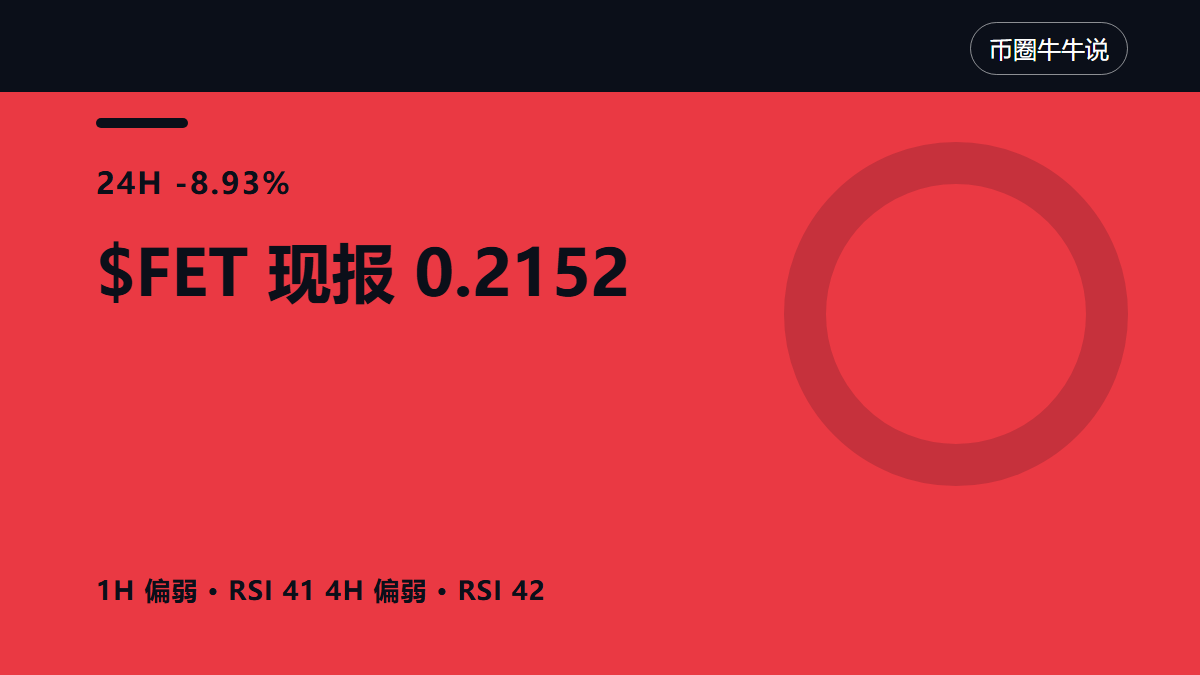

$FET is one of the AI tokens I'm watching closely, and a larger move may be coming. The BTC pair's structure is showing an interesting shift. After losing the daily range and then reclaiming it, FET/BTC has now turned bullish on the daily moving average trend. What stands out to me is its relative strength. After months of underperformance versus BTC, a clear reversal in an altcoin/BTC pair often leads to some of the strongest moves once momentum returns. The 4-hour structure also looks constructive, with price sweeping lower levels and now testing the 4-hour trend from above. I've already re-established a spot position here, and if the structure holds, I'd consider adding on deeper pullbacks. FET remains one of the AI tokens I'm focused on, and a strong swing move may be ahead. Not financial advice. Always manage risk.
展开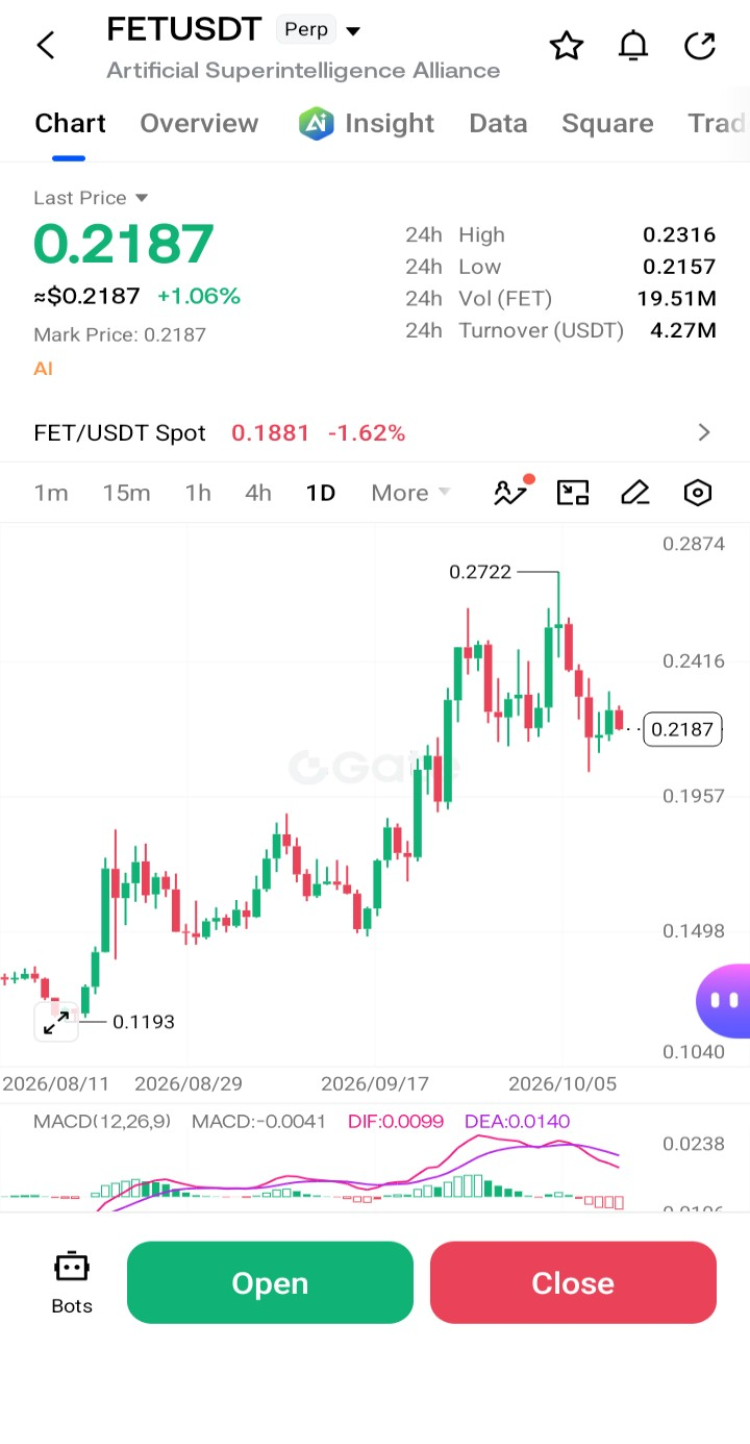
本页仅供研究参考,不构成投资建议。模型可能出错。过往表现不代表未来结果。