乐
乐观
乐观 · 25%CME
$326.49
情景价格
$295.310
+1.801 (+0.61%)收盘时
CME Group Inc. provides a derivatives marketplace. The Company enables clients to trade futures, options, cash and over the counter (OTC) markets, optimize portfolios, and analyze data. It exchanges offer a range of global benchmark products across all major asset classes based on interest rates, equity indexes, foreign exchange (FX), energy, agricultural products and metals. It offers futures and options on futures trading through the CME Globex platform, fixed income trading via BrokerTec and FX trading on the EBS platform. In addition, it operates central counterparty clearing provider, CME Clearing. Its products provide a means for hedging, speculation and asset allocation related to the risks associated with, among other things, interest rate sensitive instruments, and changes in the prices of agricultural, energy and metal commodities. It provides clearing and settlement services for a range of exchange-traded futures and options on futures contracts and OTC derivatives.
CME Group Inc is a good buy right now due to its strong financial performance and positive market indicators. The current price is $293.87, with a forward P/E ratio of 21.93, indicating reasonable valuation relative to future earnings. The RSI is at 86.08, suggesting strong momentum, although it is in overbought territory. The average analyst price target is $300, with some analysts projecting targets as high as $337, indicating potential upside of approximately 14% from the current price. The main risk is the anticipated Federal Reserve rate hike, which could impact overall market sentiment and lead to volatility.
Morgan Stanley
$337
2026-10-09
Morgan Stanley
2026-10-09
目标价
$337
Barclays
$281
2026-10-07
Barclays
2026-10-07
目标价
$281
TD Cowen
$300
2026-10-05
TD Cowen
2026-10-05
目标价
$300
UBS
$270
2026-10-05
UBS
2026-10-05
目标价
$270
Wells Fargo
$301
2026-10-01
Wells Fargo
2026-10-01
目标价
$301
情景价格取自当年最后一个月度预测区间。概率为固定的模型权重(25 / 50 / 25),不构成保证。

CME Projects Strong Q3 Earnings and Revenue Growth

Intensifying Competition in Financial Infrastructure
Microsoft Cancels UK AI Data Center Lease Amid Power Issues

China's U.S. Treasury Holdings Drop to 18-Year Low
Microsoft Cancels UK AI Data Center Lease Amid Power Issues
CME Group Inc. provides a derivatives marketplace. The Company enables clients to trade futures, options, cash and over the counter (OTC) markets, optimize portfolios, and analyze data. It exchanges offer a range of global benchmark products across all major asset classes based on interest rates, equity indexes, foreign exchange (FX), energy, agricultural products and metals. It offers futures and options on futures trading through the CME Globex platform, fixed income trading via BrokerTec and FX trading on the EBS platform. In addition, it operates central counterparty clearing provider, CME Clearing. Its products provide a means for hedging, speculation and asset allocation related to the risks associated with, among other things, interest rate sensitive instruments, and changes in the prices of agricultural, energy and metal commodities. It provides clearing and settlement services for a range of exchange-traded futures and options on futures contracts and OTC derivatives. It operates in the Financials sector (SECURITY & COMMODITY BROKERS, DEALERS, EXCHANGES & industry).
CME Group Inc is a good buy right now due to its strong financial performance and positive market indicators. The current price is $293.87, with a forward P/E ratio of 21.93, indicating reasonable valuation relative to future earnings. The RSI is at 86.08, suggesting strong momentum, although it is in overbought territory. The average analyst price target is $300, with some analysts projecting targets as high as $337, indicating potential upside of approximately 14% from the current price. The main risk is the anticipated Federal Reserve rate hike, which could impact overall market sentiment and lead to volatility.
14 analysts cover CME: 9 rate it Buy, 5 Hold and 0 Sell. The average price target is 285.90.

US regulators want to dismiss the lawsuit filed by CME against crypto perpetual contracts. → Filing submitted on October 16: CME's crypto trading volume rose from 2.66M contracts in May to 3.28M contracts in September (+23%). → CME argues that perpetual contracts are swaps, not futures.
展开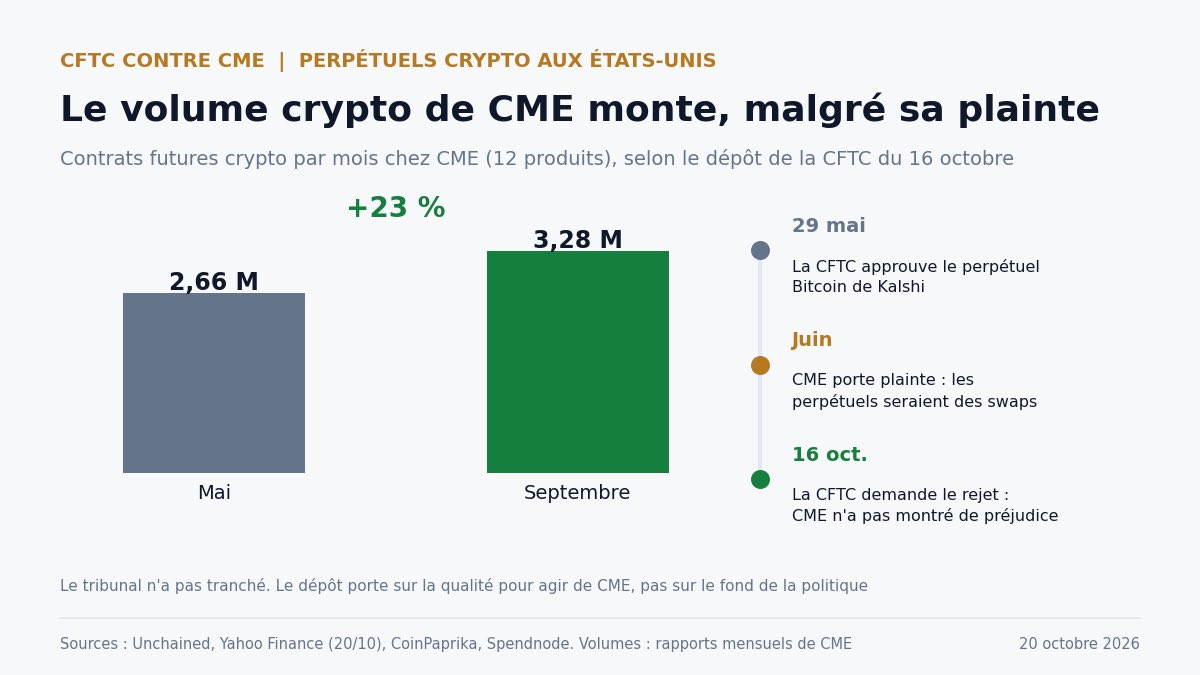

Here is the rewritten English version: Good news in crypto over the past two days: JPMorgan expanded its JPM Coin deposit token to Ethereum for institutional clients. Visa partnered with Mesh to let users spend crypto directly at 175 million merchant locations. Deutsche Bank is preparing to launch institutional-grade crypto custody services. The CFTC proposed a framework allowing crypto exchanges to opt into federal regulation instead of dealing with state-by-state licensing. CME will launch $BCH Bitcoin Cash and $UNI Uniswap futures. $BNB burned 1.65 million tokens, worth about $1.2 billion. Strategy added another 267 $BTC .
展开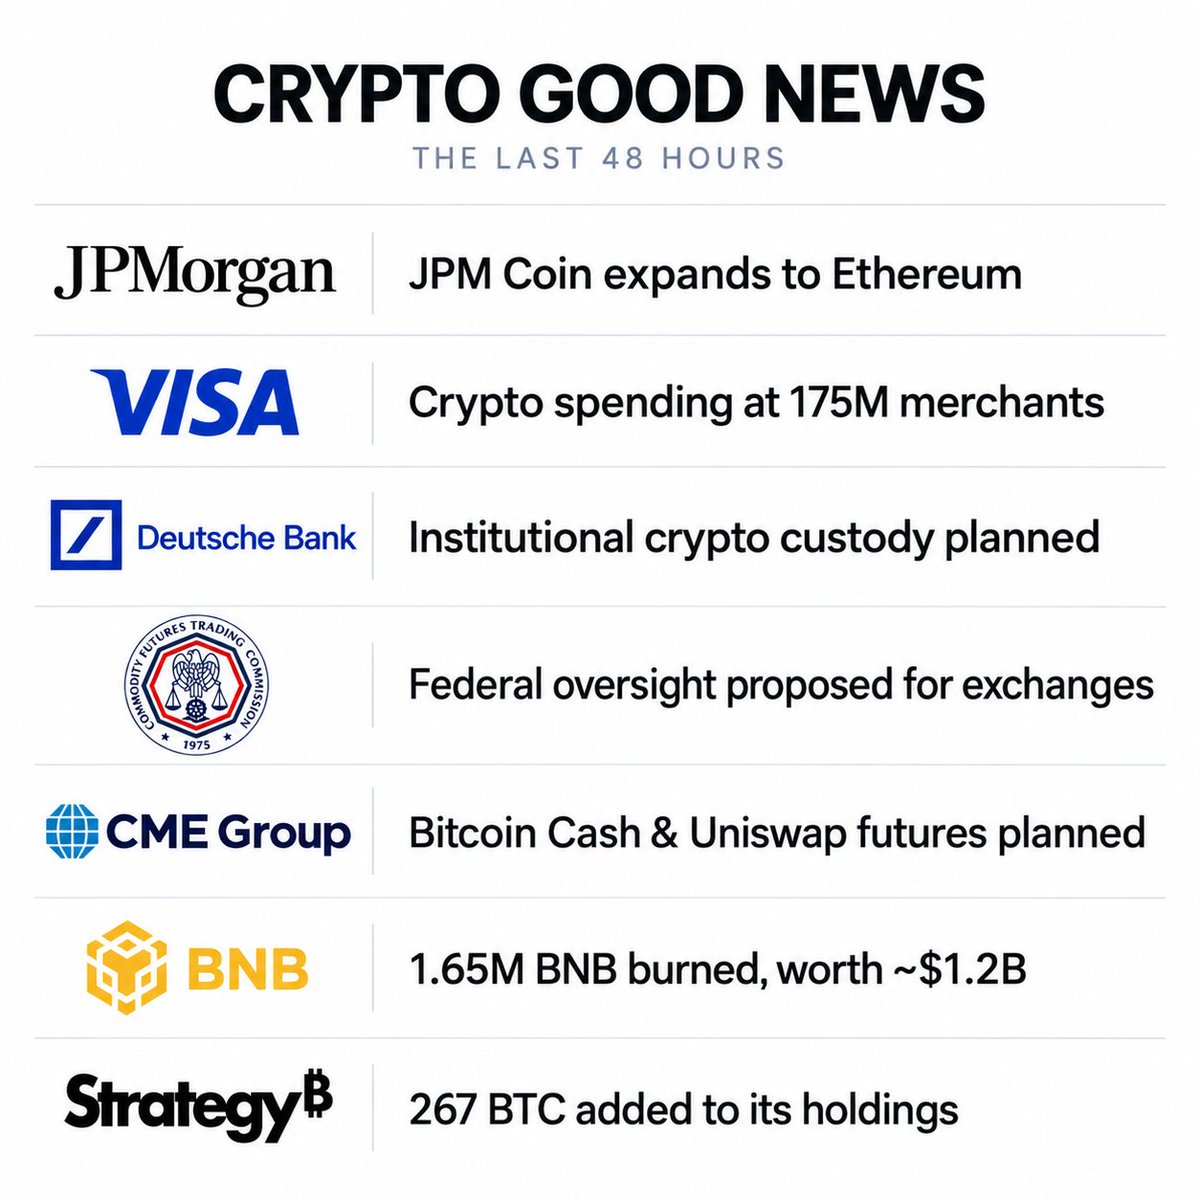

Cardano's ADA is one of 16 tokens listed as digital commodities in the SEC's March 17 announcement, with the CFTC also participating in that announcement. Bitcoin, ether, and XRP are also on the list, and CME Group has listed ADA futures since February 9. @Cardano
展开

👇🔲 Gold Financial | Fed rate hike odds surge 1️⃣ US September CPI came in above expectations, reviving inflation pressure 2️⃣ CME shows the probability of a Fed rate hike in October jumped from 22% the previous day to 50% 3️⃣ Traders expect at least one rate hike before year-end, and three more cumulative hikes by the end of 2027 4️⃣ As rate hike expectations build, risk assets come under pressure, and the crypto market needs to watch for short-term pullback risk⚠️
展开
本页仅供研究参考,不构成投资建议。模型可能出错。过往表现不代表未来结果。