
P
Pt. Biro Klasifikasi Indonesia (Persero)
+ HoldingTLK
-18.31%
3M Return
$11.780
+0.141 (+1.20%)At close
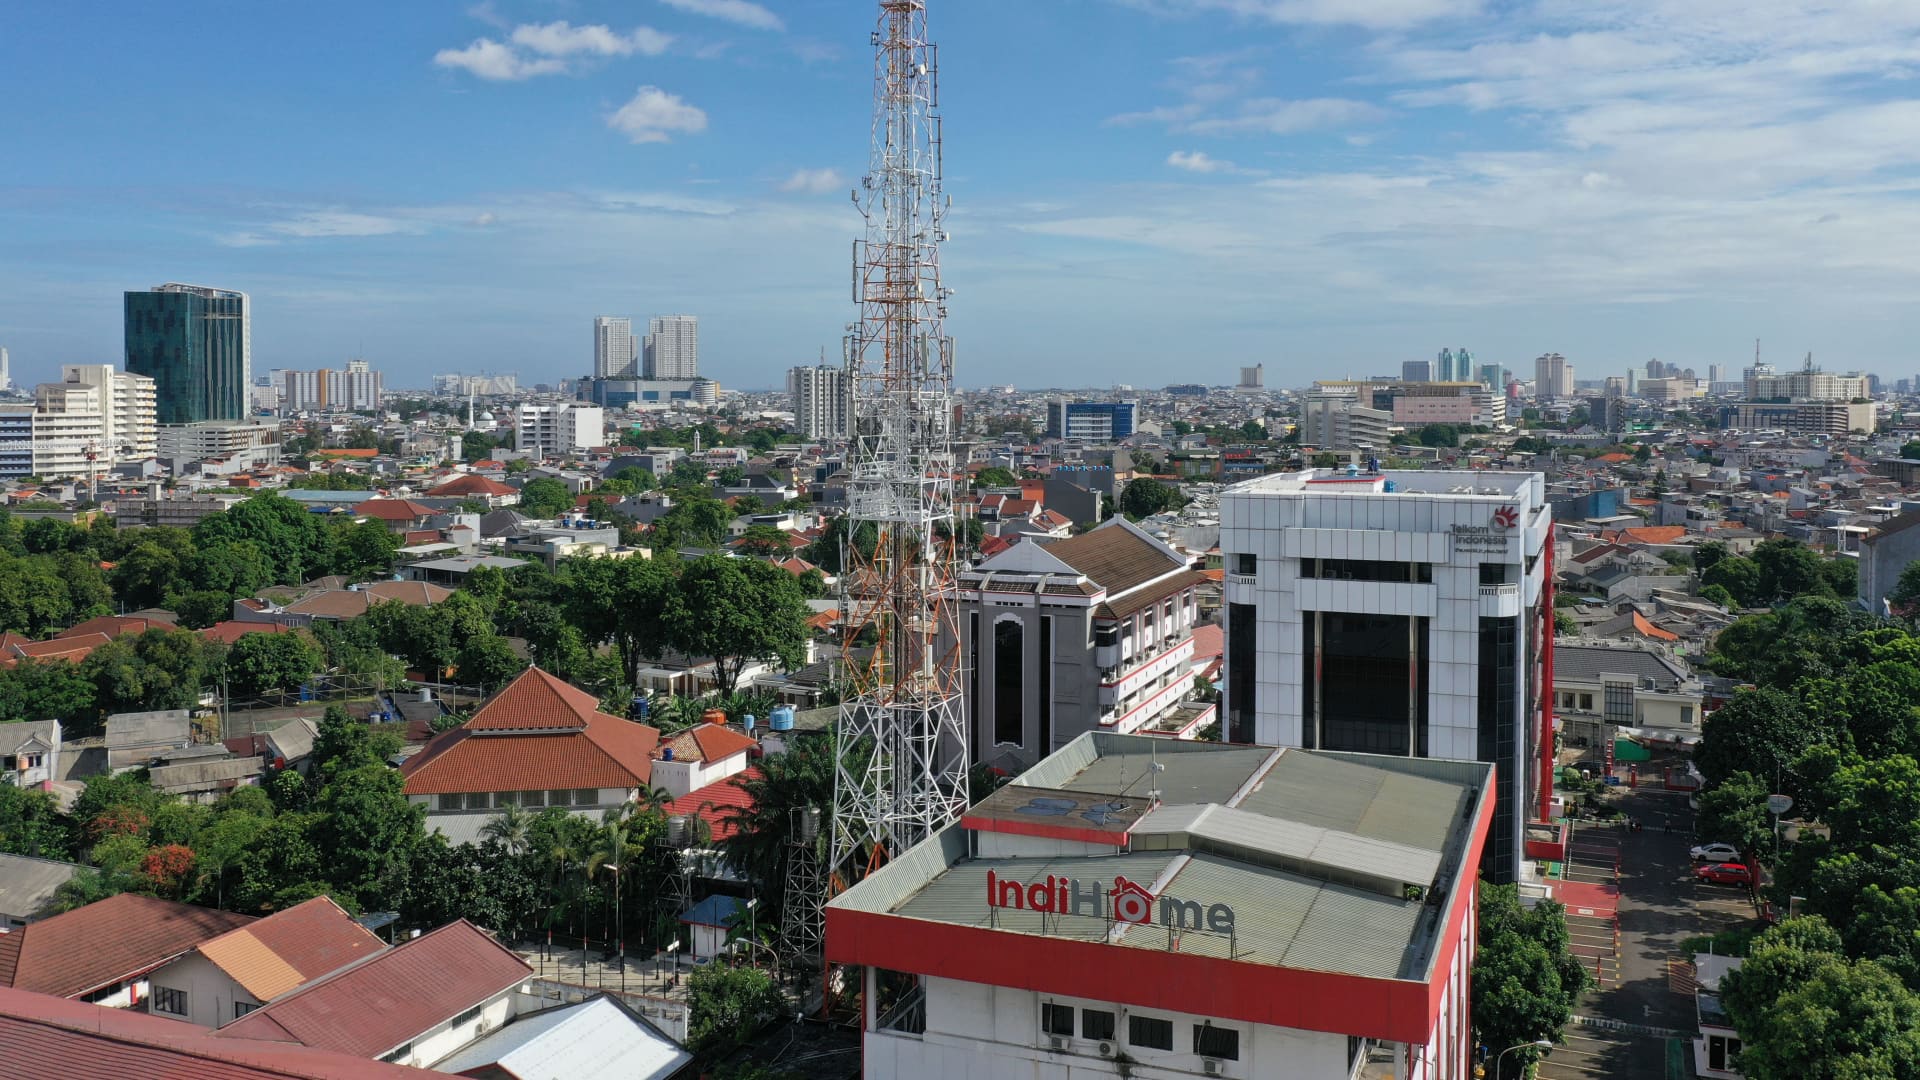
PT Telkom Indonesia (Persero) Tbk is an Indonesia-based telecommunication company. The Company is engaged in information and communication technology (ICT) services and telecommunications networks. Its segments include B2C, B2B Infra, B2B ICT, International, and Others. Its Business to Consumer (B2C) segment, comprises provision of telecommunications services to individual/residential customers, including mobile and fixed broadband services. Business-to-Business ICT (B2B ICT) provides system integration services, information technology services, and digital solutions to corporate and institutional customers. Its Business-to-Business Infrastructure (B2B Infra) offers management, and maintenance of telecommunications infrastructure, including telecommunications towers, fiber optic networks, backbone, data centers, and satellites. Its international Business segment provides international connectivity services and wholesale services to telecommunications operators and customers abroad.
Telkom Indonesia (TLK) is not a good buy right now due to significant recent losses and negative growth indicators. The stock has dropped 47.68% year-to-date and 14.03% over the last five days, indicating a strong downward trend. Additionally, the RSI is at a very low 10.385, suggesting the stock is oversold, but this could also indicate continued weakness. The forward P/E ratio is 10.101, which is relatively low, but given the recent earnings miss where the reported EPS was 0.36 against an estimate of 0.53, there are concerns about the company's ability to meet future expectations. The main risk is the company's declining revenue growth and the potential negative impact of the corruption case involving its subsidiary, which could further affect investor confidence.
BofA
—
2025-11-24
BofA
2025-11-24
Price Target
—
New Street
$3500
2025-06-18
New Street
2025-06-18
Price Target
$3500
B of A Securities
—
2023-09-20
B of A Securities
2023-09-20
Price Target
—
Indonesian Telecom Giant Weighs Sale of Venture Capital Firm

Asian Equities Rise as ADRs Track Higher in the US

Telekomunikasi Indonesia Q1 Financial Results

Telkom Indonesia Files 2025 Annual Report

Telkom Indonesia Files 2025 Annual Report
PT Telkom Indonesia (Persero) Tbk is an Indonesia-based telecommunication company. The Company is engaged in information and communication technology (ICT) services and telecommunications networks. Its segments include B2C, B2B Infra, B2B ICT, International, and Others. Its Business to Consumer (B2C) segment, comprises provision of telecommunications services to individual/residential customers, including mobile and fixed broadband services. Business-to-Business ICT (B2B ICT) provides system integration services, information technology services, and digital solutions to corporate and institutional customers. Its Business-to-Business Infrastructure (B2B Infra) offers management, and maintenance of telecommunications infrastructure, including telecommunications towers, fiber optic networks, backbone, data centers, and satellites. Its international Business segment provides international connectivity services and wholesale services to telecommunications operators and customers abroad. It operates in the Technology sector (TELEPHONE COMMUNICATIONS, EXCEPT RADIOTELEPHONE industry).
Telkom Indonesia (TLK) is not a good buy right now due to significant recent losses and negative growth indicators. The stock has dropped 47.68% year-to-date and 14.03% over the last five days, indicating a strong downward trend. Additionally, the RSI is at a very low 10.385, suggesting the stock is oversold, but this could also indicate continued weakness. The forward P/E ratio is 10.101, which is relatively low, but given the recent earnings miss where the reported EPS was 0.36 against an estimate of 0.53, there are concerns about the company's ability to meet future expectations. The main risk is the company's declining revenue growth and the potential negative impact of the corruption case involving its subsidiary, which could further affect investor confidence.
1 analysts cover TLK: 0 rate it Buy, 1 Hold and 0 Sell.
No posts yet
Sign up or log in to join the discussionThis page is for research only and is not investment advice. Models can be wrong. Past performance does not guarantee future results.