
B
Bull
Bull · 25%SXT
$122.39
Scenario price
$132.850
+0.306 (+0.23%)At close
Sensient Technologies Corporation is a manufacturer and marketer of colors, flavors and other specialty ingredients. Its Flavors & Extracts segment produces flavor, extracts, and essential oils products. The Company includes its natural ingredients business, which produces dehydrated garlic, onion, and other natural ingredients for food processors. Its Color segment produces natural and synthetic color systems for foods, beverages, pharmaceuticals, and nutraceuticals, colors, ingredients, and systems for personal care, and technical colors for industrial applications. Its Asia Pacific segment is managed on a geographic basis and produces and distributes color, flavor, and essential oils products for the Asia Pacific countries. It serves food and non-food industries. The food industry markets include savory, beverage, and sweet flavors, as well as certain bioingredients. In the non-food industries, it supplies essential oil products to the personal, homecare, and bioingredients markets.
Sensient Technologies Corp is a good buy right now due to its recent strong earnings report showing a Q2 EPS of $1.20, which exceeded expectations by $0.17, and a significant revenue growth of 11.6% year-over-year to $462.1 million. The stock's current price of $130.37 is well below the analyst price target of $157, suggesting a potential upside of 20.4%. The main risk to consider is the RSI at 48.945, indicating that the stock is neither overbought nor oversold, which could lead to volatility in the short term.
UBS
$157
2026-09-30
UBS
2026-09-30
Price Target
$157
UBS
$155
2026-07-27
UBS
2026-07-27
Price Target
$155
Baird
$140
2026-07-27
Baird
2026-07-27
Price Target
$140
Rothschild & Co Redburn
$125
2026-07-08
Rothschild & Co Redburn
2026-07-08
Price Target
$125
UBS
$143
2026-04-28
UBS
2026-04-28
Price Target
$143
Scenario prices are the last monthly forecast band of the current year. Probabilities are fixed model weights (25 / 50 / 25), not guarantees.

Sensient Technologies Reports Strong Q2 2026 Earnings Growth
Sensient Technologies Q2 Earnings Exceed Expectations

Sensient Reports 11.6% Revenue Growth in Q2 Earnings
Sensient Technologies Declares Quarterly Cash Dividend

US Stocks Close Higher as Market Sentiment Improves
Sensient Technologies Corporation is a manufacturer and marketer of colors, flavors and other specialty ingredients. Its Flavors & Extracts segment produces flavor, extracts, and essential oils products. The Company includes its natural ingredients business, which produces dehydrated garlic, onion, and other natural ingredients for food processors. Its Color segment produces natural and synthetic color systems for foods, beverages, pharmaceuticals, and nutraceuticals, colors, ingredients, and systems for personal care, and technical colors for industrial applications. Its Asia Pacific segment is managed on a geographic basis and produces and distributes color, flavor, and essential oils products for the Asia Pacific countries. It serves food and non-food industries. The food industry markets include savory, beverage, and sweet flavors, as well as certain bioingredients. In the non-food industries, it supplies essential oil products to the personal, homecare, and bioingredients markets. It operates in the Basic Materials sector (INDUSTRIAL ORGANIC CHEMICALS industry).
Sensient Technologies Corp is a good buy right now due to its recent strong earnings report showing a Q2 EPS of $1.20, which exceeded expectations by $0.17, and a significant revenue growth of 11.6% year-over-year to $462.1 million. The stock's current price of $130.37 is well below the analyst price target of $157, suggesting a potential upside of 20.4%. The main risk to consider is the RSI at 48.945, indicating that the stock is neither overbought nor oversold, which could lead to volatility in the short term.
5 analysts cover SXT: 3 rate it Buy, 2 Hold and 0 Sell.

$TRB $NYM $SXT Many people focus on finding the next big crypto opportunity, but having the right knowledge and guidance is what really helps you stay consistent. I've personally found Craig's approach to trading very different from the usual hype you see online. Following his guidance has helped me become more confident with my decisions and less likely to trade emotionally whenever the market gets volatile. I'm still learning every day, but the difference in my mindset and overall approach to trading has been noticeable.
Show more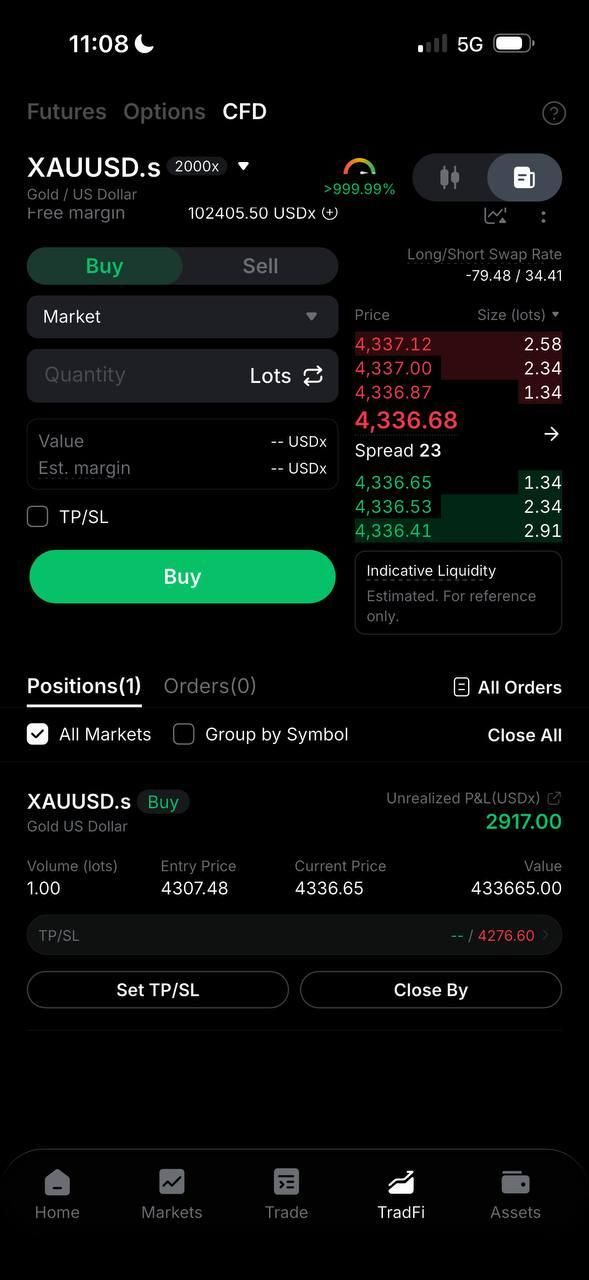

$SXT is at 0.00829 now, short-term bullish. Entry 0.00822-0.00829, TP1 0.00837, TP2 0.00845, SL 0.00819. Reason: MA5 is slightly below MA20 but the gap is very small, RSI 46.9 is not overbought, MACD histogram has turned positive, the lower Bollinger Band at 0.00822 acts as support, and the Fear & Greed Index at 69 still leans greedy. Compared with SHELL and ESP, all three have similar 24h declines, but SXT's MACD has turned bullish while ESP remains bearish, making SXT relatively more resilient among peers. Also watching: $B and $CHR are relatively weaker than SXT. (Personal view only, for reference only, not any investment advice. Futures risk is extremely high, please strictly control position size.) [Data] Pair: SXTUSDT Direction: Long Entry: 0.00822-0.00829 TP1: 0.00837 TP2: 0.00845 SL: 0.00819
Show more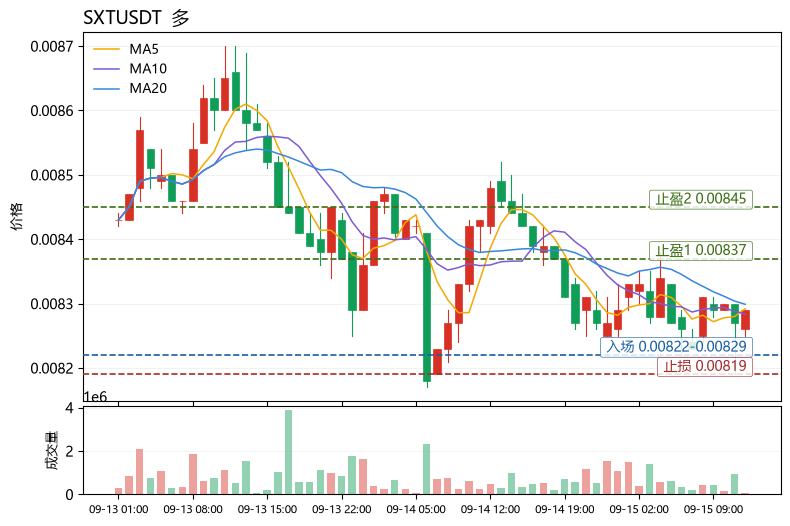
This page is for research only and is not investment advice. Models can be wrong. Past performance does not guarantee future results.