
B
Bull
Bull · 25%SWK
$65.69
Scenario price
$92.480
-0.268 (-0.29%)At close
Stanley Black & Decker Inc. is a global provider of hand tools, power tools, outdoor products and related accessories, as well as a provider of engineered fastening solutions. The Company's segments include Tools & Outdoor and Engineered Fastening. The Tools & Outdoor segment is comprised of the Power Tools Group (PTG), Hand Tools, Accessories & Storage (HTAS), and Outdoor Power Equipment (Outdoor) product lines. The PTG product line includes both professional and consumer products. The HTAS product line sells hand tools, power tool accessories and storage products. The Outdoor product line primarily sells corded and cordless electric lawn and garden products. The Engineered Fastening segment sells engineered components such as fasteners, fittings and various engineered products, which are designed for specific applications across multiple verticals. Its brands include DEWALT, CRAFTSMAN, STANLEY, BLACK+DECKER, DEWALT FLEXVOLT, IRWIN, LENOX, PORTER-CABLE, among others.
Currently, Stanley Black & Decker Inc is not an ideal buy. The current price is $88.57, with a forward P/E ratio of 14.51 indicating potential value but also reflecting market caution. The RSI is at 41.10, suggesting the stock is nearing oversold territory but not yet a strong buy signal. The gross margin stands at 30.71%, which is decent but not exceptionally high. Analyst targets range from $90 to $107, indicating a potential upside of 1.5% to 20.9%. However, the stock has experienced a 3.03% decline over the last five days, and the overall market sentiment is negative, with 40% of S&P 500 stocks in bear territory. The main risk is the recent 5-day change of -3.03%, indicating short-term volatility and uncertainty in the market.
Melius Research
$100
2026-10-06
Melius Research
2026-10-06
Price Target
$100
Wells Fargo
$95
2026-09-11
Wells Fargo
2026-09-11
Price Target
$95
Morgan Stanley
$96
2026-08-10
Morgan Stanley
2026-08-10
Price Target
$96
Citi
$107
2026-07-31
Citi
2026-07-31
Price Target
$107
Goldman Sachs
$93
2026-07-29
Goldman Sachs
2026-07-29
Price Target
$93
Scenario prices are the last monthly forecast band of the current year. Probabilities are fixed model weights (25 / 50 / 25), not guarantees.
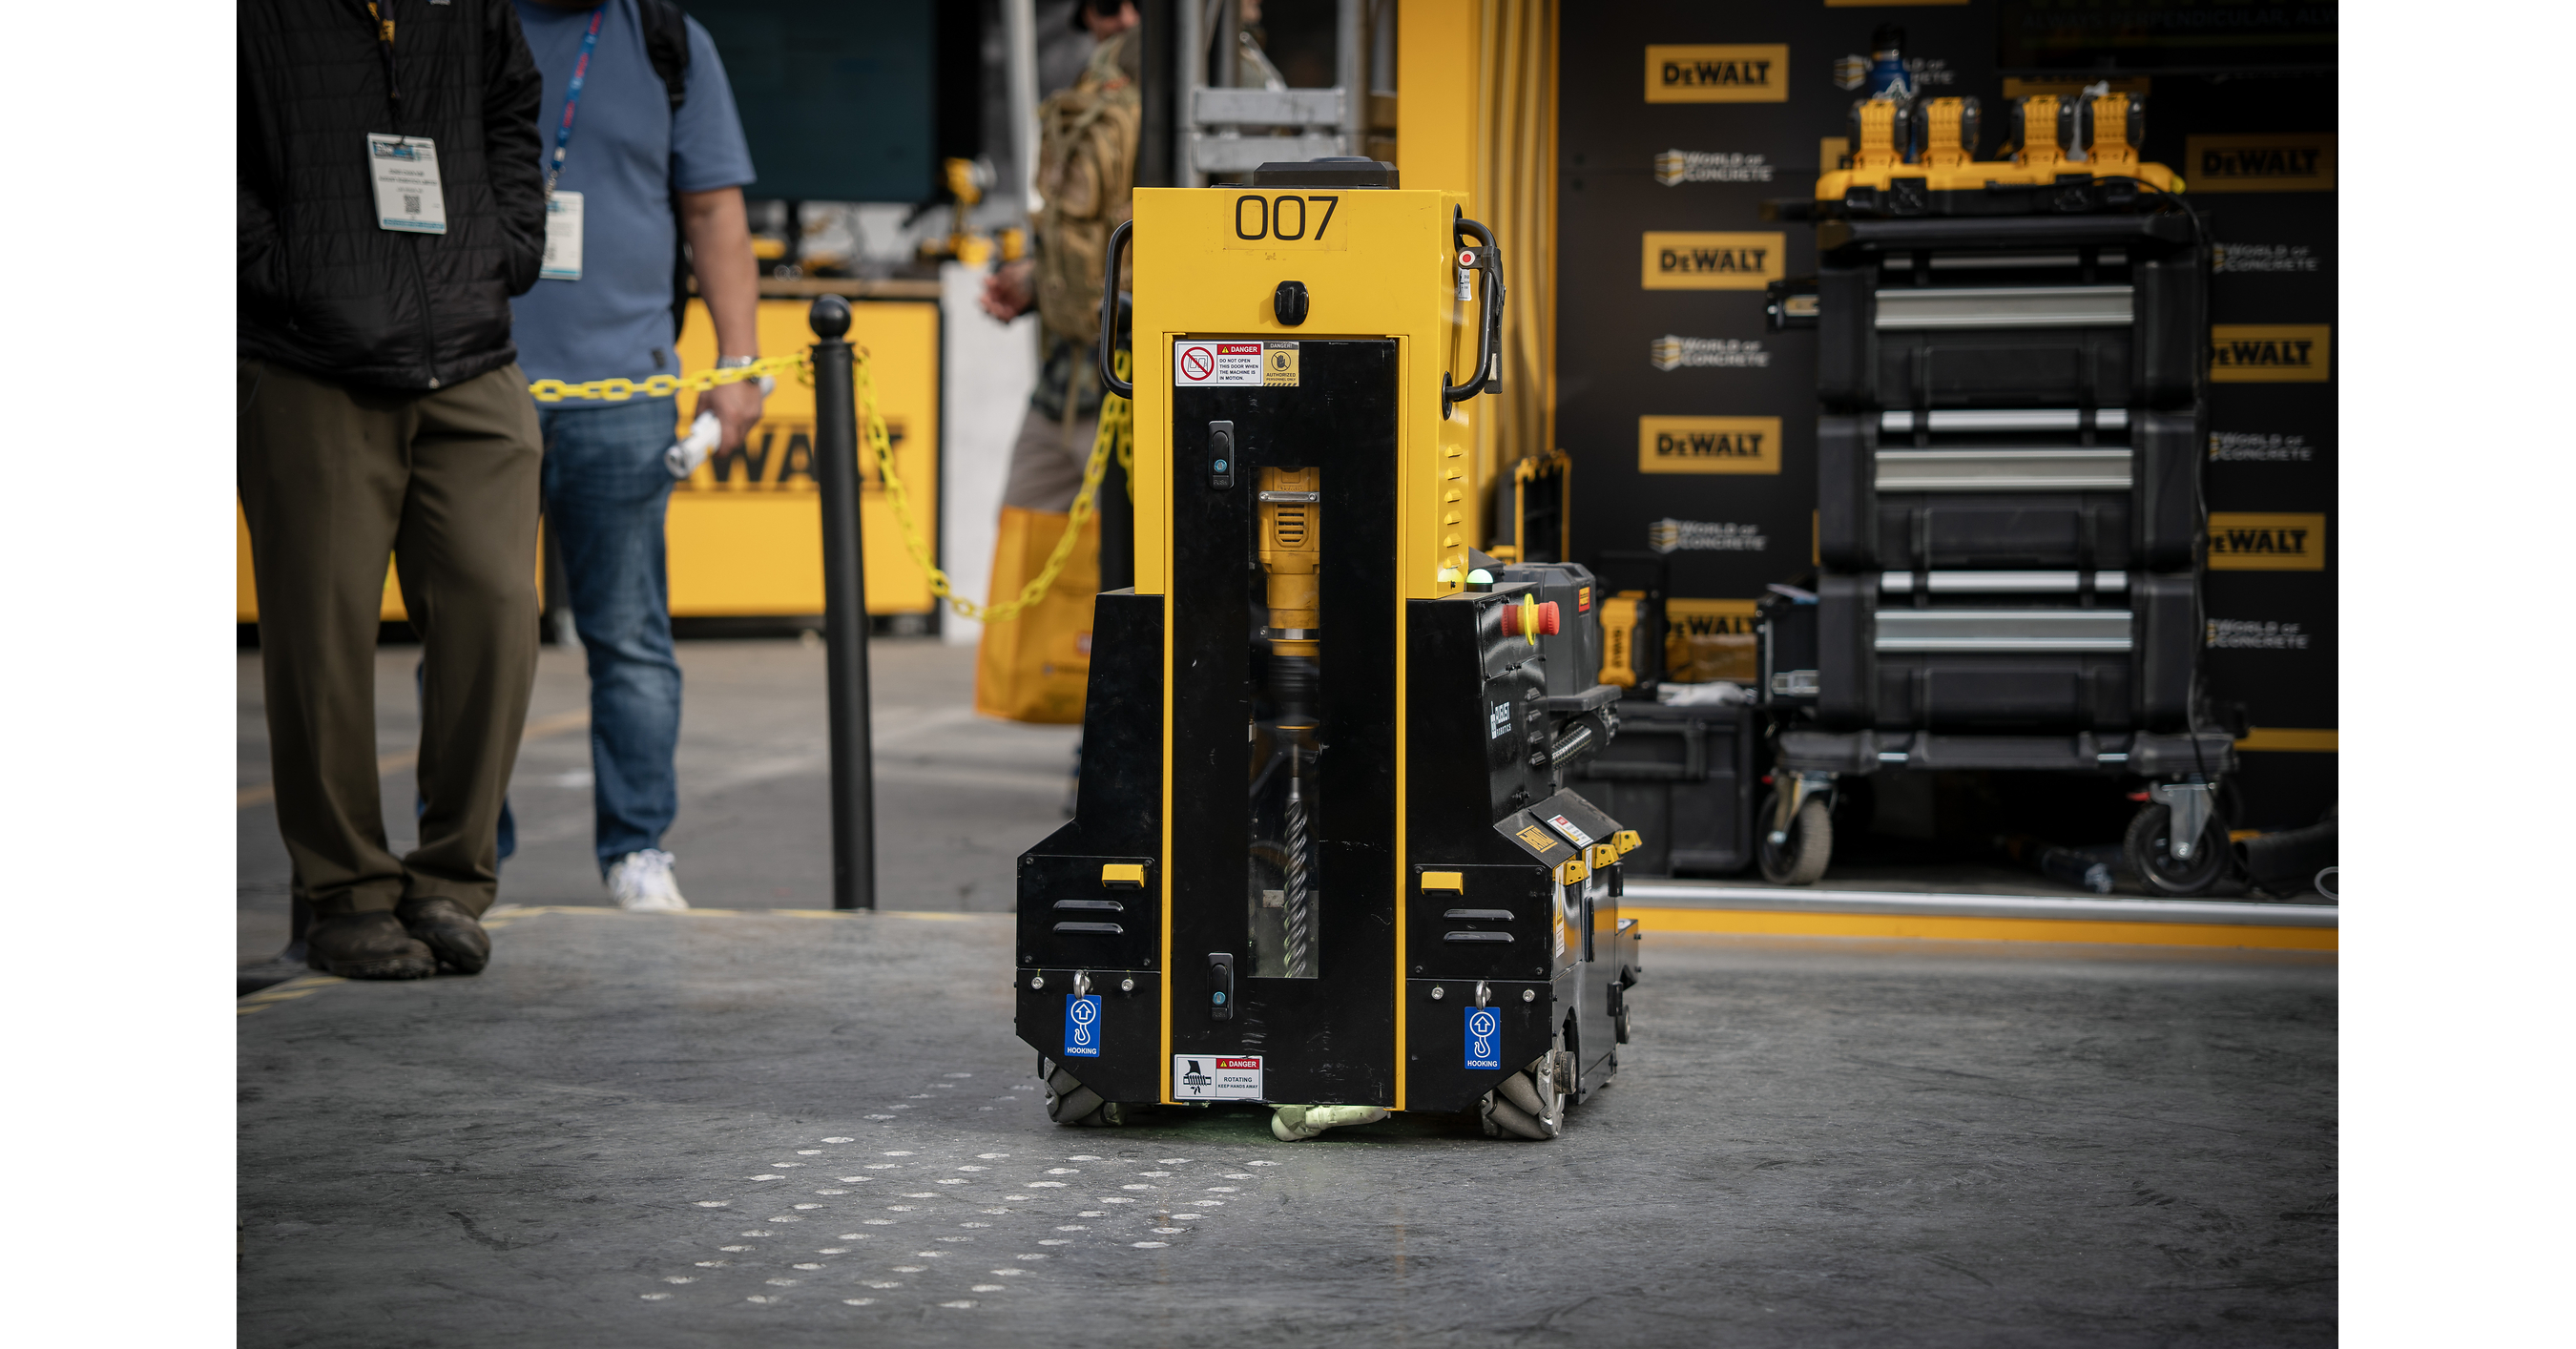
DEWALT's Autonomous Drilling Robot Named TIME's Best Invention of 2026

White Cap and DEWALT Partner to Support St. Jude Children's Research Hospital

White Cap and DEWALT Partner to Support St. Jude Children's Research Hospital

Recommended Defensive Stocks for Market Pullbacks

DEWALT Launches World's First Downward Drilling Robot DALE™
Stanley Black & Decker Inc. is a global provider of hand tools, power tools, outdoor products and related accessories, as well as a provider of engineered fastening solutions. The Company's segments include Tools & Outdoor and Engineered Fastening. The Tools & Outdoor segment is comprised of the Power Tools Group (PTG), Hand Tools, Accessories & Storage (HTAS), and Outdoor Power Equipment (Outdoor) product lines. The PTG product line includes both professional and consumer products. The HTAS product line sells hand tools, power tool accessories and storage products. The Outdoor product line primarily sells corded and cordless electric lawn and garden products. The Engineered Fastening segment sells engineered components such as fasteners, fittings and various engineered products, which are designed for specific applications across multiple verticals. Its brands include DEWALT, CRAFTSMAN, STANLEY, BLACK+DECKER, DEWALT FLEXVOLT, IRWIN, LENOX, PORTER-CABLE, among others. It operates in the Industrials sector (CUTLERY, HANDTOOLS & GENERAL HARDWARE industry).
Currently, Stanley Black & Decker Inc is not an ideal buy. The current price is $88.57, with a forward P/E ratio of 14.51 indicating potential value but also reflecting market caution. The RSI is at 41.10, suggesting the stock is nearing oversold territory but not yet a strong buy signal. The gross margin stands at 30.71%, which is decent but not exceptionally high. Analyst targets range from $90 to $107, indicating a potential upside of 1.5% to 20.9%. However, the stock has experienced a 3.03% decline over the last five days, and the overall market sentiment is negative, with 40% of S&P 500 stocks in bear territory. The main risk is the recent 5-day change of -3.03%, indicating short-term volatility and uncertainty in the market.
23 analysts cover SWK: 15 rate it Buy, 8 Hold and 0 Sell. The average price target is 84.89.
No posts yet
Sign up or log in to join the discussionThis page is for research only and is not investment advice. Models can be wrong. Past performance does not guarantee future results.