
Y
Yelin Lapidot Holdings Ltd.
+ HoldingSILC
+0.00%
3M Return
$26.570
-4.342 (-16.34%)At close
Silicom Ltd. is an Israel‑based company that designs, manufactures and markets networking and data‑infrastructure hardware for servers and communications systems. The Company operates through business segments that include network interface cards, intelligent programmable cards and edge‑to‑cloud infrastructure solutions. Silicom’s products include a range of network interface adapters, intelligent offload and acceleration cards based on field programmable gate array (FPGA) technology, and other hardware solutions designed for networking, security and data‑center applications. The Company serves markets such as network appliances, servers, data‑storage systems, cloud and virtualized data centers with and without software‑defined networking (SDN), and the Internet of Things (IoT).
Silicom Ltd is currently not a strong buy due to its recent price decline and technical indicators, despite a positive long-term outlook. The current price is $31.02, which is significantly lower than the 52-week high of $63.00, indicating a potential for recovery. However, the RSI is at 23.111, suggesting the stock is oversold, and the recent 5-day change is -22.64%, indicating a bearish trend. The forward P/E ratio is 10.7181, which is reasonable, but the company still faces profitability challenges as shown by its recent net income figures, with a net loss of $341,000 in Q3 2026. The main risk is the volatility of the stock, as evidenced by a 20% drop following an earnings report, which could deter new investors.
Needham
$60
2026-07-02
Needham
2026-07-02
Price Target
$60
Needham
—
2025-02-03
Needham
2025-02-03
Price Target
—
Needham
—
2024-07-30
Needham
2024-07-30
Price Target
—
Needham
$20
2024-05-03
Needham
2024-05-03
Price Target
$20
Needham
$22
2023-10-27
Needham
2023-10-27
Price Target
$22

Silicom Expands Relationship with Cyber Security Client

Silicom Secures Design Win with Tier-1 Cybersecurity Customer

Silicom Reports 59% Revenue Growth in Q2 2026

Silicom Secures Major Design Win, Revenue Set to Surge

Silicom Secures New Design Win, Revenue Expected to Surge
Silicom Ltd. is an Israel‑based company that designs, manufactures and markets networking and data‑infrastructure hardware for servers and communications systems. The Company operates through business segments that include network interface cards, intelligent programmable cards and edge‑to‑cloud infrastructure solutions. Silicom’s products include a range of network interface adapters, intelligent offload and acceleration cards based on field programmable gate array (FPGA) technology, and other hardware solutions designed for networking, security and data‑center applications. The Company serves markets such as network appliances, servers, data‑storage systems, cloud and virtualized data centers with and without software‑defined networking (SDN), and the Internet of Things (IoT). It operates in the Technology sector (COMPUTER COMMUNICATIONS EQUIPMENT industry).
Silicom Ltd is currently not a strong buy due to its recent price decline and technical indicators, despite a positive long-term outlook. The current price is $31.02, which is significantly lower than the 52-week high of $63.00, indicating a potential for recovery. However, the RSI is at 23.111, suggesting the stock is oversold, and the recent 5-day change is -22.64%, indicating a bearish trend. The forward P/E ratio is 10.7181, which is reasonable, but the company still faces profitability challenges as shown by its recent net income figures, with a net loss of $341,000 in Q3 2026. The main risk is the volatility of the stock, as evidenced by a 20% drop following an earnings report, which could deter new investors.
2 analysts cover SILC: 2 rate it Buy, 0 Hold and 0 Sell.

Typically hesitant to post micro cap stocks, but Silicom showed up this weekend on @InvestorsBusinessDaily MarketSurge near pivot lists. Volume has picked up here this year (no position) $SILC
Show more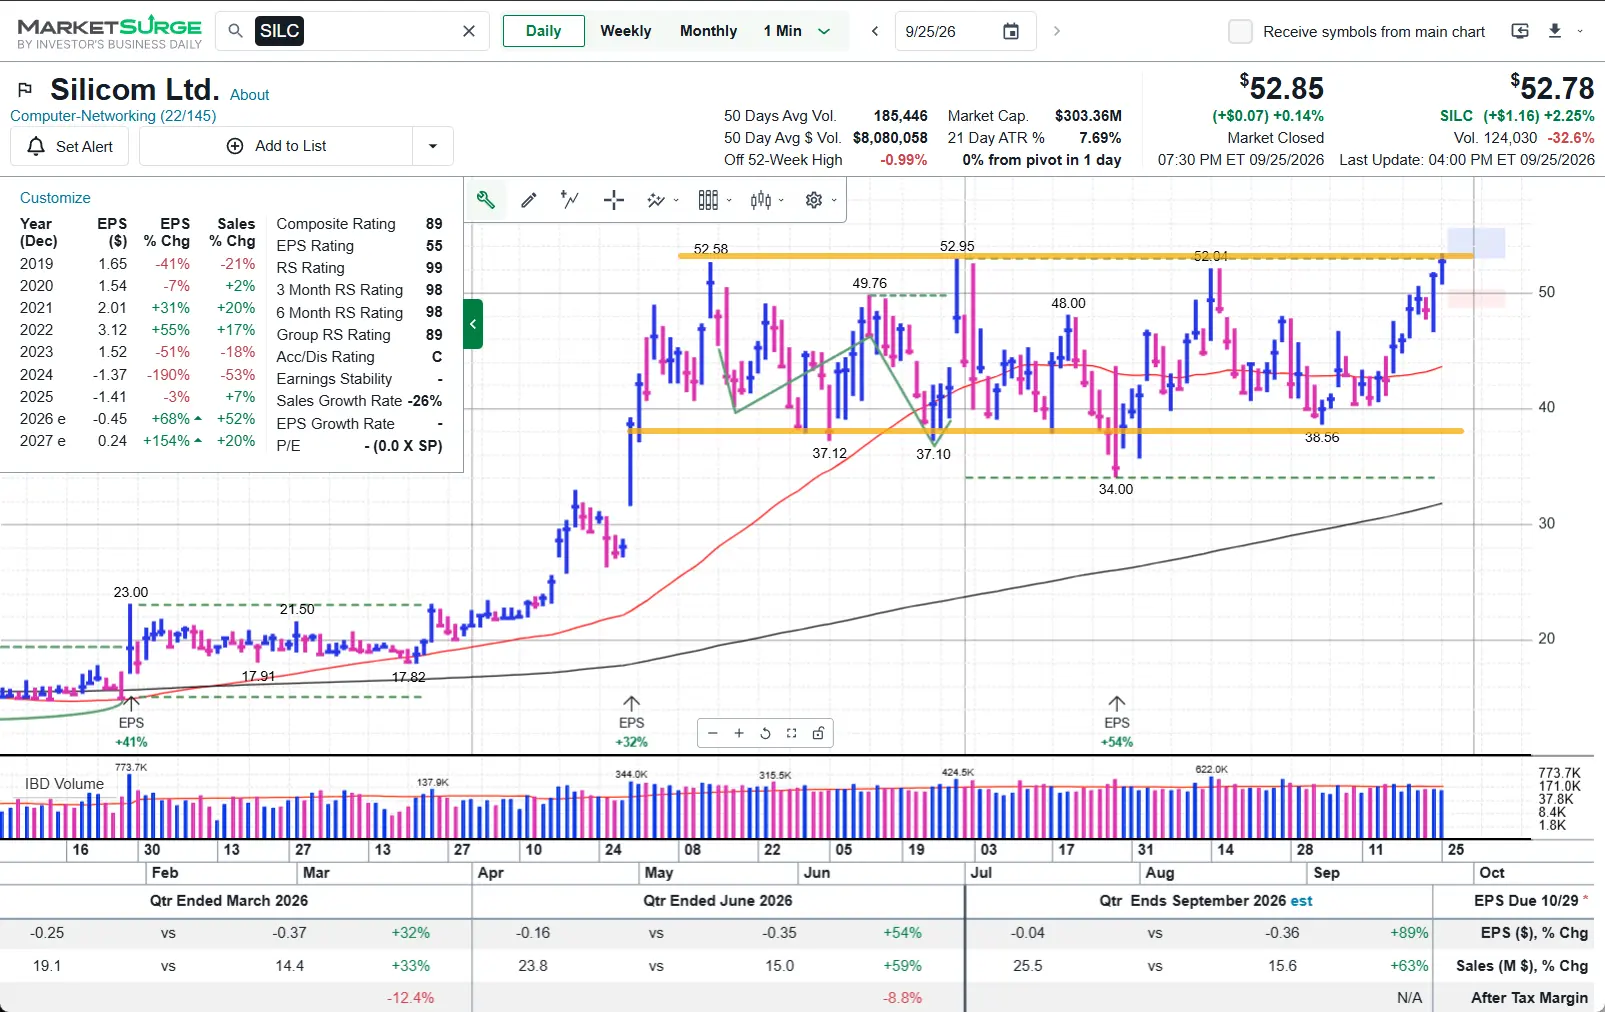
This page is for research only and is not investment advice. Models can be wrong. Past performance does not guarantee future results.