
D
Duquesne Family Office LLC
+ HoldingQ
+8.54%
3M Return
$115.370
-4.084 (-3.54%)At close
Qnity Electronics, Inc. is engaged in providing materials and solutions for semiconductor and electronics industries. The Company has two business segments, namely Semiconductor Technologies and Interconnect Solutions. The Semiconductor Technologies segment provides a portfolio of materials and solutions utilized across multiple stages of the semiconductor manufacturing process. These materials are integrated into customers' roadmaps and are intended to support improvements in chip performance, production yield, and the implementation of advanced node technologies. The Interconnect Solutions segment offers a comprehensive range of material solutions that address the complexities of signal integrity, thermal and power management, and advanced packaging. These solutions are used in advanced electronics hardware applications, including complex printed circuit boards and advanced semiconductor packaging.
Qnity Electronics Inc is currently not a strong buy due to its low RSI of 15.25, indicating oversold conditions, and a recent price drop of 8.87% over the last five days. However, it has a solid forward P/E of 24.75 and a gross margin of 43.11%, suggesting good profitability. The main risk is the recent market volatility and inflation pressures, which could impact future growth.
Monthly Meeting Review and Outlook on Portfolio

Qnity Electronics Declares Quarterly Dividend of $0.08

Inflation Pressures Mount, Market Reacts Sharply

Qnity: A Key Player in the Semiconductor Industry

Key Wall Street Rating Changes on Wednesday
Qnity Electronics, Inc. is engaged in providing materials and solutions for semiconductor and electronics industries. The Company has two business segments, namely Semiconductor Technologies and Interconnect Solutions. The Semiconductor Technologies segment provides a portfolio of materials and solutions utilized across multiple stages of the semiconductor manufacturing process. These materials are integrated into customers' roadmaps and are intended to support improvements in chip performance, production yield, and the implementation of advanced node technologies. The Interconnect Solutions segment offers a comprehensive range of material solutions that address the complexities of signal integrity, thermal and power management, and advanced packaging. These solutions are used in advanced electronics hardware applications, including complex printed circuit boards and advanced semiconductor packaging. It operates in the Technology sector.
Qnity Electronics Inc is currently not a strong buy due to its low RSI of 15.25, indicating oversold conditions, and a recent price drop of 8.87% over the last five days. However, it has a solid forward P/E of 24.75 and a gross margin of 43.11%, suggesting good profitability. The main risk is the recent market volatility and inflation pressures, which could impact future growth.

$Q Buyers are still in control, support is valid, looking for upward movement.
Show more

🚨 CT/USDT — Key Levels to Watch | 4H Market Analysis 🔥 CT is up +21.00%! Buyers are showing strong momentum, pushing the price above key moving averages. But after a sharp rally, can bulls maintain control or will profit-taking trigger a pullback? 👀 💰 Current Price: $0.38435 📈 24H Change: +21.00% 📊 24H High: $0.44030 📉 24H Low: $0.28506 💵 24H Turnover: $1.81M 📊 Technical Structure CT is trading above all three moving averages, signaling strong short-term bullish momentum. • MA(5): $0.35281 • MA(10): $0.32849 • MA(20): $0.31575 🟢 Support Levels Immediate Support: $0.36870–$0.35281 Strong Support: $0.32849–$0.32226 Major Support: $0.31575–$0.28506 🔴 Resistance Levels Immediate Resistance: $0.40000–$0.41515 Major Resistance: $0.44030 Upside Target: $0.45641–$0.48000 🚀 Bullish Scenario If CT holds above $0.36870 and breaks through $0.40000–$0.41515 with strong buying volume, bulls could challenge the $0.44030 high. A confirmed breakout may open a path toward $0.45641 and potentially $0.48000. ⚠️ Bearish Scenario If momentum weakens and CT loses $0.36870, a pullback toward $0.35281 becomes possible. Further selling could send the price toward $0.32849–$0.32226. 📈 Volume Confirmation 24-hour turnover stands at $1.81M, while the latest displayed volume is around 781.64K. The price rally is supported by a bullish moving-average structure, but sustained buying volume is needed to confirm another breakout. Watch for increased volume near resistance rather than reacting to a sudden spike. 🎯 Trading Strategy Breakout watch: A strong close above $0.41515 with volume. Pullback watch: Price reaction around $0.36870–$0.35281. Risk management: Avoid chasing after a 21% rally; wait for confirmation and define your invalidation level. 💬 Your Prediction: Can CT break $0.44030 and reach $0.48000, or is a correction coming first? 👍 Like, comment your target, and follow for more crypto market analysis. Educational purposes only. Not financial advice. Always manage your risk. $CT $BR $Q
Show more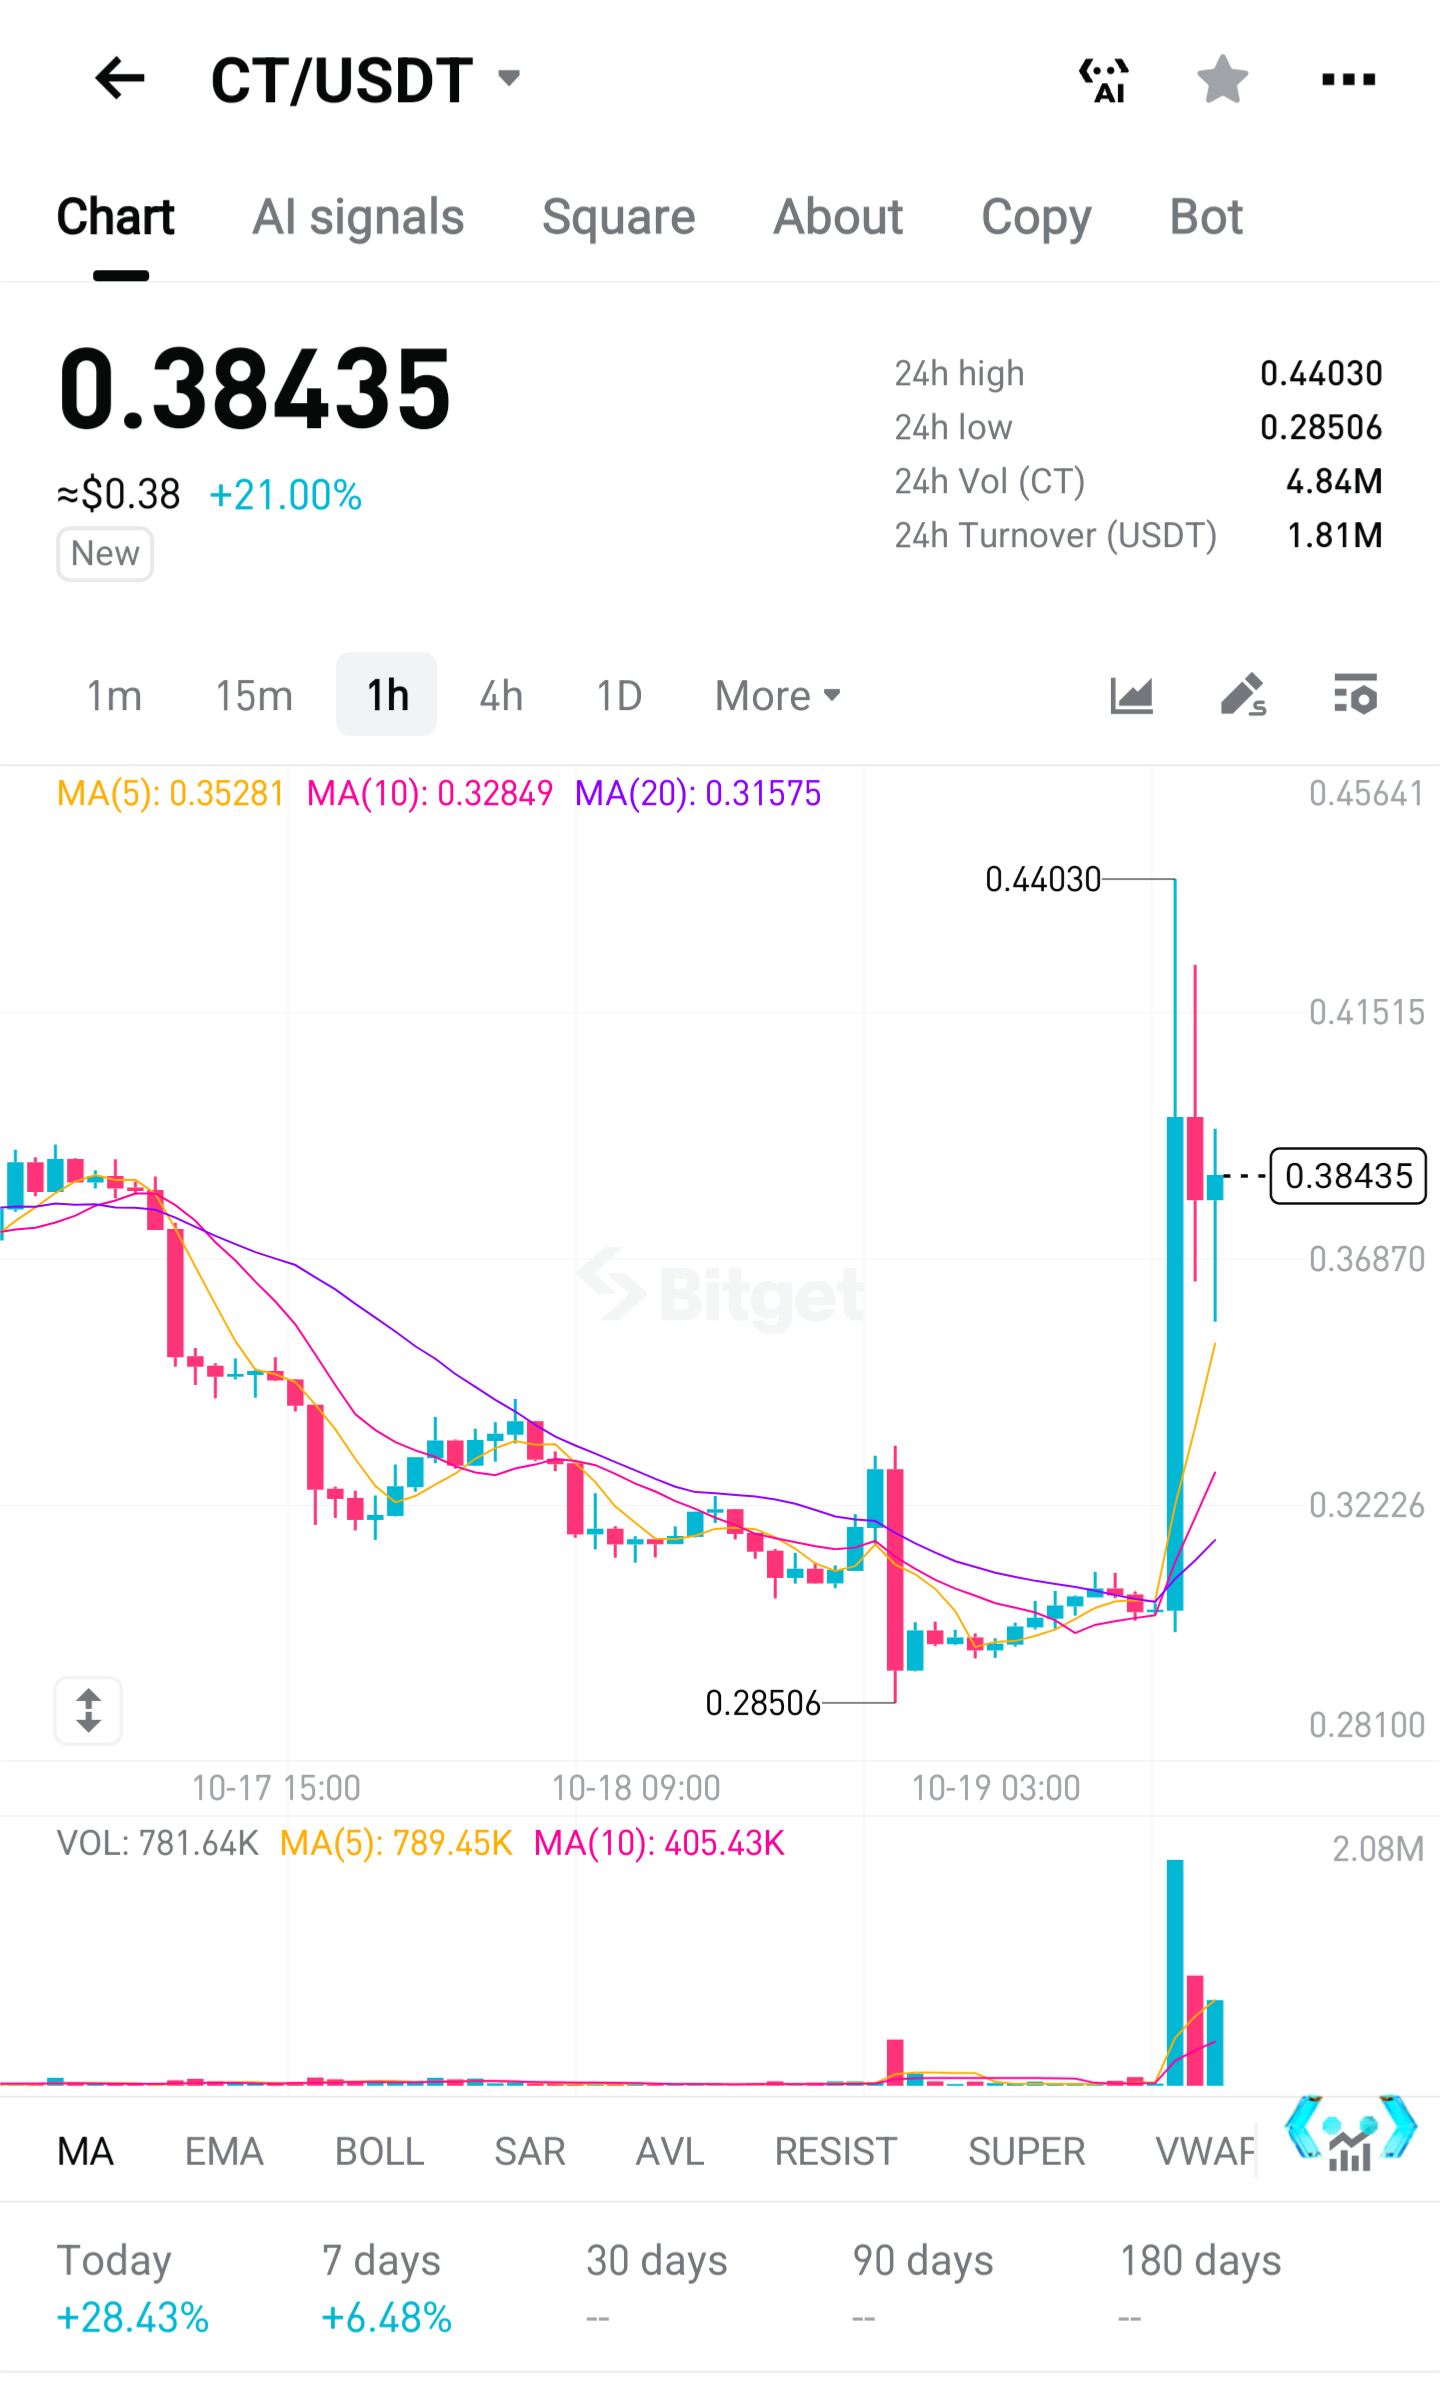

$Q dropped from 0.20 to 0.13 — this move hit the short side right where it hurts. This one was indeed fierce. Just a moment ago it was still around 0.20, and in the blink of an eye it dropped to around 0.13. So what comes next — a shakeout followed by another leg up, or a continued slide? $SOL Which way Q goes still depends on whether the key support holds, and on how much incremental capital is willing to stay with it. If support holds and volume comes back to reclaim the level, then a shakeout followed by another push becomes more likely. If it breaks down and the rebound lacks strength, then the risk of a sharper slide rises noticeably. The market moves every day. Some chase pumps and dump into drops, some ride the trend and take their cut — the difference is whether you can read the rhythm. Trading was never about being right once; it's about consistently putting profits in your pocket!! $ZEC
Show more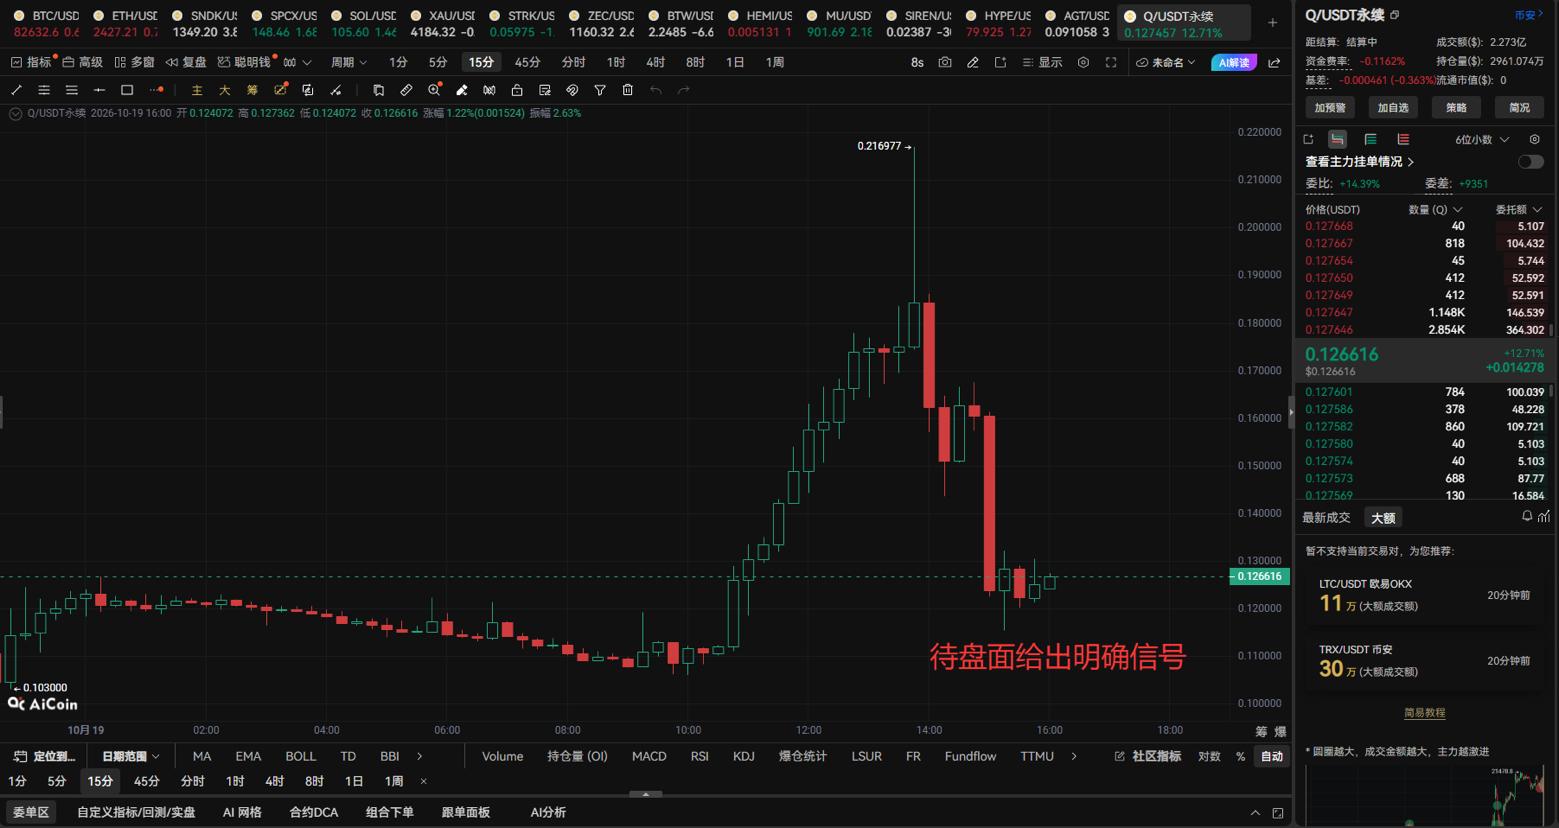

This page is for research only and is not investment advice. Models can be wrong. Past performance does not guarantee future results.