
R
Route One Investment Company, L.P.
+ HoldingNYT
+9.57%
3M Return
$68.070
+0.293 (+0.43%)At close
The New York Times Company is a global media company focused on creating and distributing news and information that helps its audience understand and engage with the world. Its core news product, The New York Times (The Times), is available on its mobile application, on its website (NYTimes.com) and as a printed newspaper, and associated content, such as its podcasts. Its other interest-specific products, including The Athletic (its sports media product), Audio (its audio offering available as a separate subscription through its news app), Cooking (its recipes and cooking content product) and Games (its puzzle games product), which are available on mobile applications and websites, and Wirecutter (its product review and recommendation offering). Its related businesses, such as its licensing operations, its commercial printing operations and other products and services under The Times brand. The Times’s print edition newspaper is published seven days a week in the United States.
The New York Times Co is a good buy right now due to its current price of $67.78, which is below the analyst price target of $82, indicating a potential upside of 21%. Additionally, the company has shown a strong 20.88% increase in its stock price over the past year, which reflects solid long-term growth. The main risk is the forward P/E ratio of 21.097, which suggests that the stock may be overvalued if earnings do not meet expectations in the upcoming quarters.
Morgan Stanley
$75
2026-10-11
Morgan Stanley
2026-10-11
Price Target
$75
Guggenheim
$82
2026-09-15
Guggenheim
2026-09-15
Price Target
$82
Citi
$85
2026-08-06
Citi
2026-08-06
Price Target
$85
Barclays
$63
2026-08-06
Barclays
2026-08-06
Price Target
$63
BofA
$80
2026-06-24
BofA
2026-06-24
Price Target
$80

The New York Times Company to Release Q3 Financial Results

DOJ Investigates White House Press Pool's Coverage Suspension of Trump

Berkshire Hathaway's Investment Strategy and Value Stock Analysis

Jim Cramer: Meta's AI Impact on Consumer Stocks May Be Overstated
The New York Times Company Declares Quarterly Dividend
The New York Times Company is a global media company focused on creating and distributing news and information that helps its audience understand and engage with the world. Its core news product, The New York Times (The Times), is available on its mobile application, on its website (NYTimes.com) and as a printed newspaper, and associated content, such as its podcasts. Its other interest-specific products, including The Athletic (its sports media product), Audio (its audio offering available as a separate subscription through its news app), Cooking (its recipes and cooking content product) and Games (its puzzle games product), which are available on mobile applications and websites, and Wirecutter (its product review and recommendation offering). Its related businesses, such as its licensing operations, its commercial printing operations and other products and services under The Times brand. The Times’s print edition newspaper is published seven days a week in the United States. It operates in the Consumer Cyclicals sector (NEWSPAPERS: PUBLISHING OR PUBLISHING & PRINTING industry).
The New York Times Co is a good buy right now due to its current price of $67.78, which is below the analyst price target of $82, indicating a potential upside of 21%. Additionally, the company has shown a strong 20.88% increase in its stock price over the past year, which reflects solid long-term growth. The main risk is the forward P/E ratio of 21.097, which suggests that the stock may be overvalued if earnings do not meet expectations in the upcoming quarters.
5 analysts cover NYT: 0 rate it Buy, 4 Hold and 1 Sell. The average price target is 69.33.

Media Muddle $NYT The New York Times ($NYT) is currently caught in a tug-of-war between its recent recovery and near-term selling pressure. After a sharp drop in late September, the stock staged a solid rebound but is now facing a key pullback. With the price hovering around $67.77, traders are asking a key question: is this a healthy retracement before the next leg up, or is the rebound losing momentum? 📊 Candlestick Analysis 1. Daily Chart (Macro Context) · Trend: The daily chart (Figure 1) shows a V-shaped recovery from a late-September low near $58.78. After surging to a local high of $73.17, the stock entered its current correction phase. · Moving Averages: Price is currently sandwiched between short-term moving averages. It recently fell below MA5 and MA10 (around $67.40) but found support above MA30 ($65.08). · Momentum (MACD): The daily MACD remains in positive territory, but the histogram shows weakening bullish momentum, suggesting the uptrend is slowing. 2. 4-Hour Chart (Medium-Term Trend) · Trend: Figure 2 shows a clear "lower highs" structure forming after the $69.81 peak. Price has been steadily declining, forming a series of red candles. · Moving Averages: Price has fallen below MA5 ($67.88) and MA10 ($68.49). MA30 at $67.72 is providing immediate but fragile support. · Momentum (MACD): The 4-hour MACD has crossed below the zero line, confirming that short-term sellers are in control on this timeframe. 3. 15-Minute Chart (Micro Execution) · Trend: The micro view (Figure 3) shows a sustained downtrend. The stock is struggling to break above MA30 ($68.47), which acts as dynamic resistance. · Price Action: Price recently touched a low of $67.62 and is now consolidating. Candle bodies are small, indicating hesitation near this support level. · Momentum (MACD): The 15-minute MACD is deep in negative territory. Although it has flattened slightly, no clear bullish divergence has appeared to signal an imminent reversal. 💡 Trading Plan Based on the confluence of signals across the charts, short-term momentum is bearish, but the stock is testing a key daily support zone. Key Levels: · Resistance: $68.50 - $69.00 (recent breakdown zone and moving average resistance), followed by $69.81 (swing high). · Support: $67.60 (immediate low), followed by the daily MA30 at $65.08. Scenario A: Bearish Continuation (Higher-Probability Short) · Trigger: A clear 15-minute or 1-hour candle close below $67.60. · Entry: Short on the breakdown, or on a small bounce to $67.70. · Target: First target at $66.00, second target at $65.20 (daily MA30 support). · Stop Loss: Above $68.50 (to guard against a sudden reversal). Scenario B: Bullish Reversal (Lower-Probability Long) · Trigger: Price needs to hold the $67.60 area and form a strong bullish reversal candle on the 1-hour chart (e.g., hammer or engulfing pattern), pushing back above the 4-hour MA10 ($68.49). · Entry: Long above $68.55. · Target: $69.80 (retest of recent high). · Stop Loss: Below $67.60 (recent swing low). ⚠️ Trader's Note: The overall market trend (SPY/QQQ) will have a major impact on NYT. If the broader market sells off, NYT could easily break below the $67.60 support. Wait for candle closes before executing trades; don't try to catch a falling knife mid-way through a 15-minute downtrend.
Show more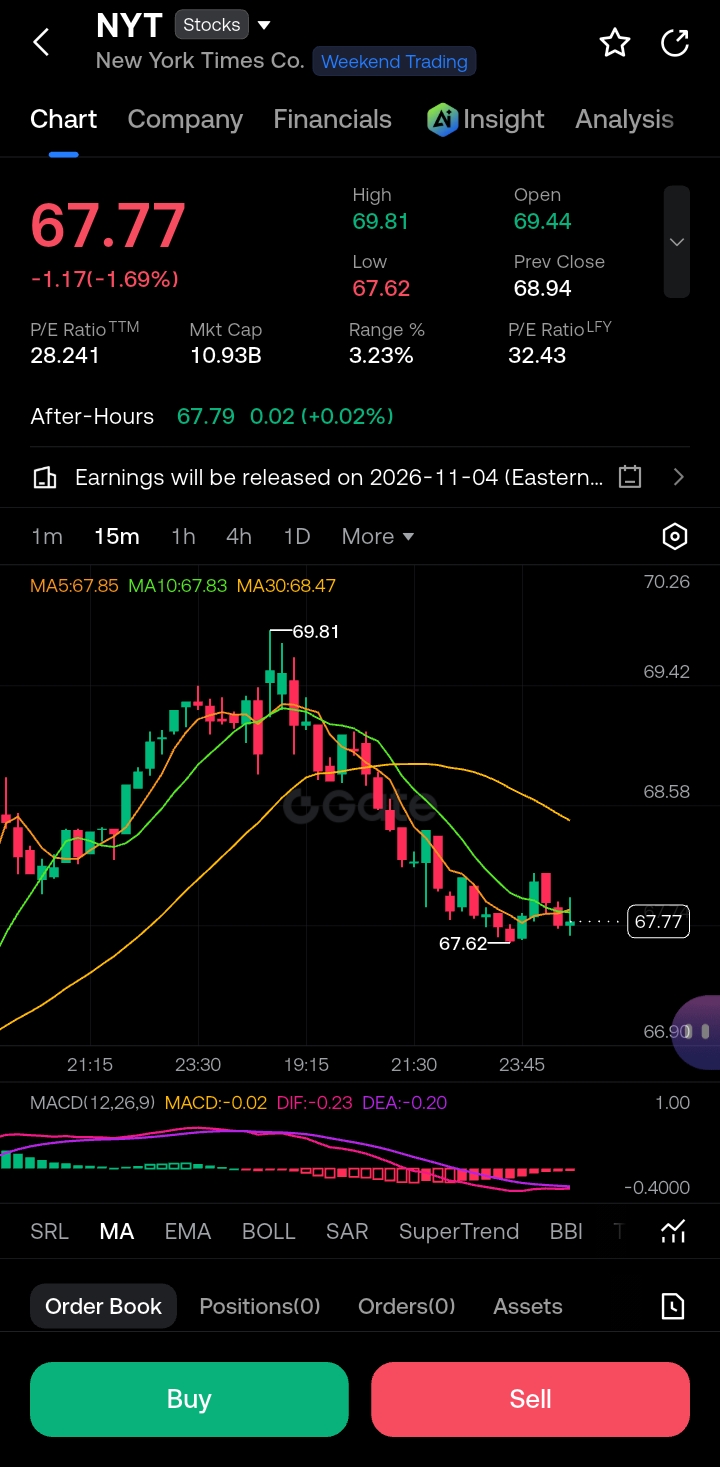
This page is for research only and is not investment advice. Models can be wrong. Past performance does not guarantee future results.