B
Bull
Bull · 25%NFLX
$1,575.19
Scenario price
$70.530
-2.017 (-2.86%)At close
Netflix, Inc. is a provider of entertainment services. The Company acquires, licenses and produces content, including original programming. It provides paid memberships in over 190 countries offering television (TV) series, films and games across a variety of genres and languages. It allows members to play, pause and resume watching as much as they want, anytime, anywhere, and can change their plans at any time. The Company offers members the ability to receive streaming content through a host of Internet-connected devices, including TVs, digital video players, TV set-top boxes and mobile devices. It is engaged in scaling its streaming service, such as introducing games and advertising on its service, as well as offering live programming. It is developing technology and utilizing third-party cloud computing, technology and other services. The Company is also engaged in scaling its own studio operations to produce original content.
Netflix Inc is currently priced at $70.53, which is significantly below the average analyst price target of $80, indicating potential upside. However, the stock has a Relative Strength Index (RSI) of 48.74, suggesting it is neither overbought nor oversold, indicating a neutral momentum. The main risk is the company's declining viewership, with only a 2% increase reported in the first half of 2023, which could impact future revenue growth.
Morgan Stanley
$80
2026-10-08
Morgan Stanley
2026-10-08
Price Target
$80
Barclays
$70
2026-10-07
Barclays
2026-10-07
Price Target
$70
Wells Fargo
$57
2026-10-01
Wells Fargo
2026-10-01
Price Target
$57
Guggenheim
$80
2026-10-01
Guggenheim
2026-10-01
Price Target
$80
Deutsche Bank
—
2026-09-30
Deutsche Bank
2026-09-30
Price Target
—
Scenario prices are the last monthly forecast band of the current year. Probabilities are fixed model weights (25 / 50 / 25), not guarantees.
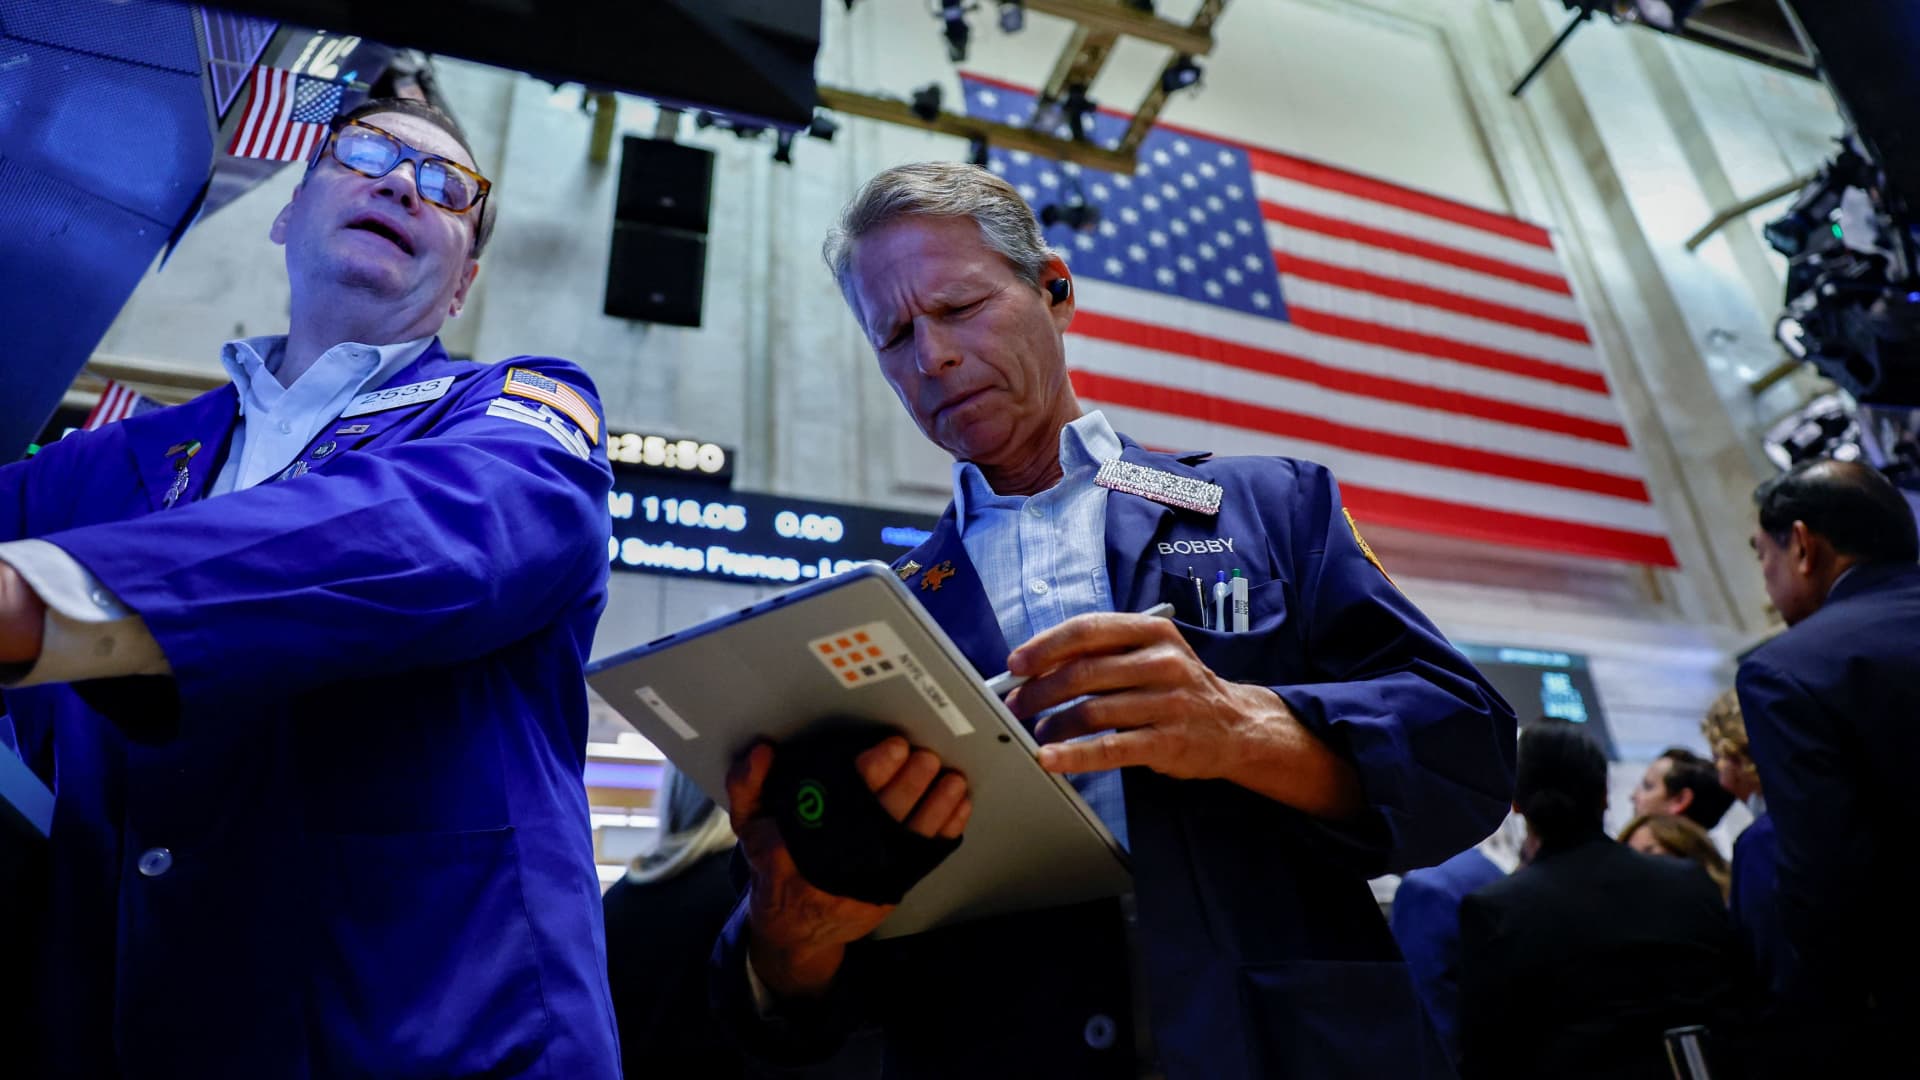
Strong Outlook for Q3 Earnings Season Amid Market Caution

Wall Street Experiences Sell-Off on Friday

Netflix Reshuffles C-Suite to Address Engagement Challenges
Netflix Appoints Peter Rice as Chief Content Officer Amid Stagnating Viewership

Independent Bank Surpasses Q3 Earnings Estimates
Netflix, Inc. is a provider of entertainment services. The Company acquires, licenses and produces content, including original programming. It provides paid memberships in over 190 countries offering television (TV) series, films and games across a variety of genres and languages. It allows members to play, pause and resume watching as much as they want, anytime, anywhere, and can change their plans at any time. The Company offers members the ability to receive streaming content through a host of Internet-connected devices, including TVs, digital video players, TV set-top boxes and mobile devices. It is engaged in scaling its streaming service, such as introducing games and advertising on its service, as well as offering live programming. It is developing technology and utilizing third-party cloud computing, technology and other services. The Company is also engaged in scaling its own studio operations to produce original content. It operates in the Technology sector (SERVICES-VIDEO TAPE RENTAL industry).
Netflix Inc is currently priced at $70.53, which is significantly below the average analyst price target of $80, indicating potential upside. However, the stock has a Relative Strength Index (RSI) of 48.74, suggesting it is neither overbought nor oversold, indicating a neutral momentum. The main risk is the company's declining viewership, with only a 2% increase reported in the first half of 2023, which could impact future revenue growth.
41 analysts cover NFLX: 25 rate it Buy, 14 Hold and 2 Sell. The average price target is 114.18.




Netflix is reportedly preparing to lay off 5% of its workforce amid a growth slowdown. $NFLX
Show moreThis page is for research only and is not investment advice. Models can be wrong. Past performance does not guarantee future results.