B
Bull
Bull · 25%MU
$198.53
Scenario price
$856.490
-53.616 (-6.26%)At close
Micron Technology, Inc. provides memory and storage solutions. The Company delivers a portfolio of high-performance dynamic random-access memory (DRAM), NAND, and NOR memory and storage products through its Micron and Crucial brands. The Company's products enable advancing in artificial intelligence (AI) and compute-intensive applications. Its segments include Cloud Memory Business Unit (CMBU), Core Data Center Business Unit (CDBU), Mobile and Client Business Unit (MCBU) and Automotive and Embedded Business Unit (AEBU). CMBU is focused on memory solutions for large hyperscale cloud customers, and high bandwidth memory (HBM) for all data center customers. CDBU is focused on memory solutions for mid-tier cloud, enterprise, and OEM data center customers and storage solutions for all data center customers. MCBU is focused on memory and storage solutions for mobile and client segments. AEBU is focused on memory and storage solutions for the automotive, industrial, and consumer segments.
Micron Technology Inc is a good buy right now due to its strong financial performance and positive catalysts. The stock's current price is $878.84, with a forward P/E ratio of 7.0175, indicating it is undervalued compared to its earnings potential. Additionally, the gross margin has reached an impressive 86.76% in the latest quarter, reflecting robust profitability. However, the main risk is the RSI at 19.671, indicating the stock is oversold and may face short-term volatility.
DA Davidson
—
2026-10-07
DA Davidson
2026-10-07
Price Target
—
Rosenblatt
—
2026-10-02
Rosenblatt
2026-10-02
Price Target
—
Deutsche Bank
$1550
2026-10-01
Deutsche Bank
2026-10-01
Price Target
$1550
DA Davidson
—
2026-10-01
DA Davidson
2026-10-01
Price Target
—
Mizuho
—
2026-10-01
Mizuho
2026-10-01
Price Target
—
Scenario prices are the last monthly forecast band of the current year. Probabilities are fixed model weights (25 / 50 / 25), not guarantees.

Micron Technology Surpasses Expectations, Stock Pullback
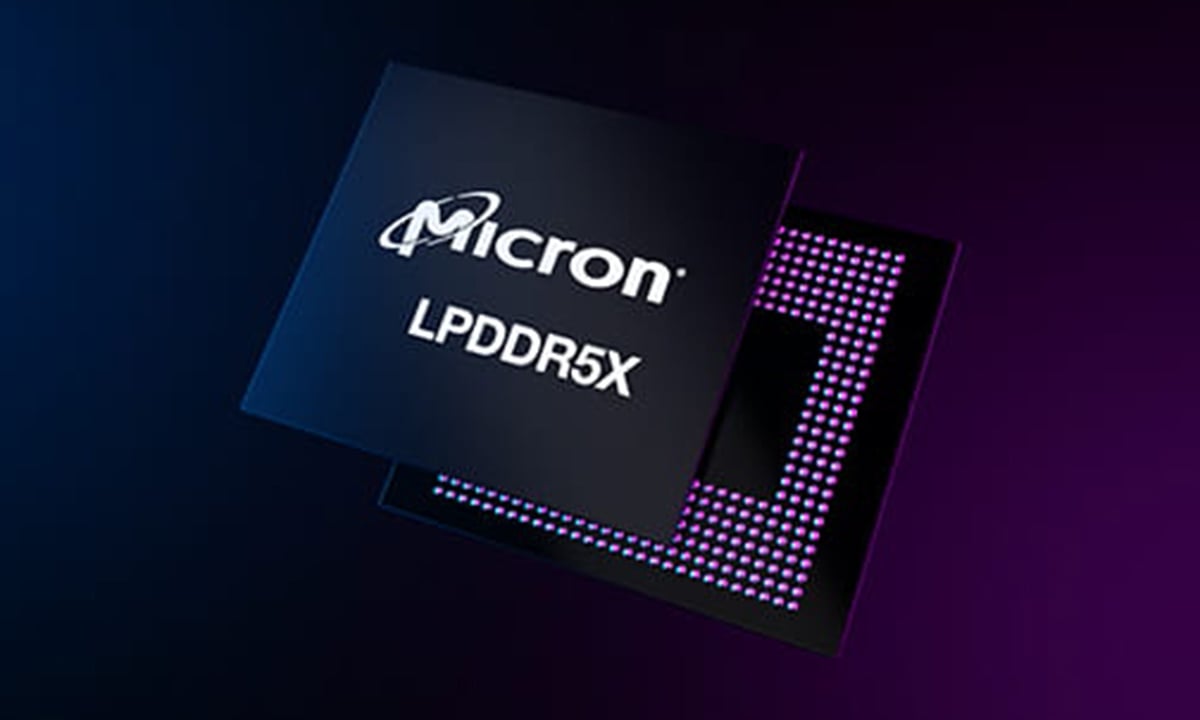
Micron Technology Surpasses $1 Trillion Market Cap Amid AI Demand Surge

Micron Technology Stock Drops Amid Rising Oil Prices and AI Spending Concerns
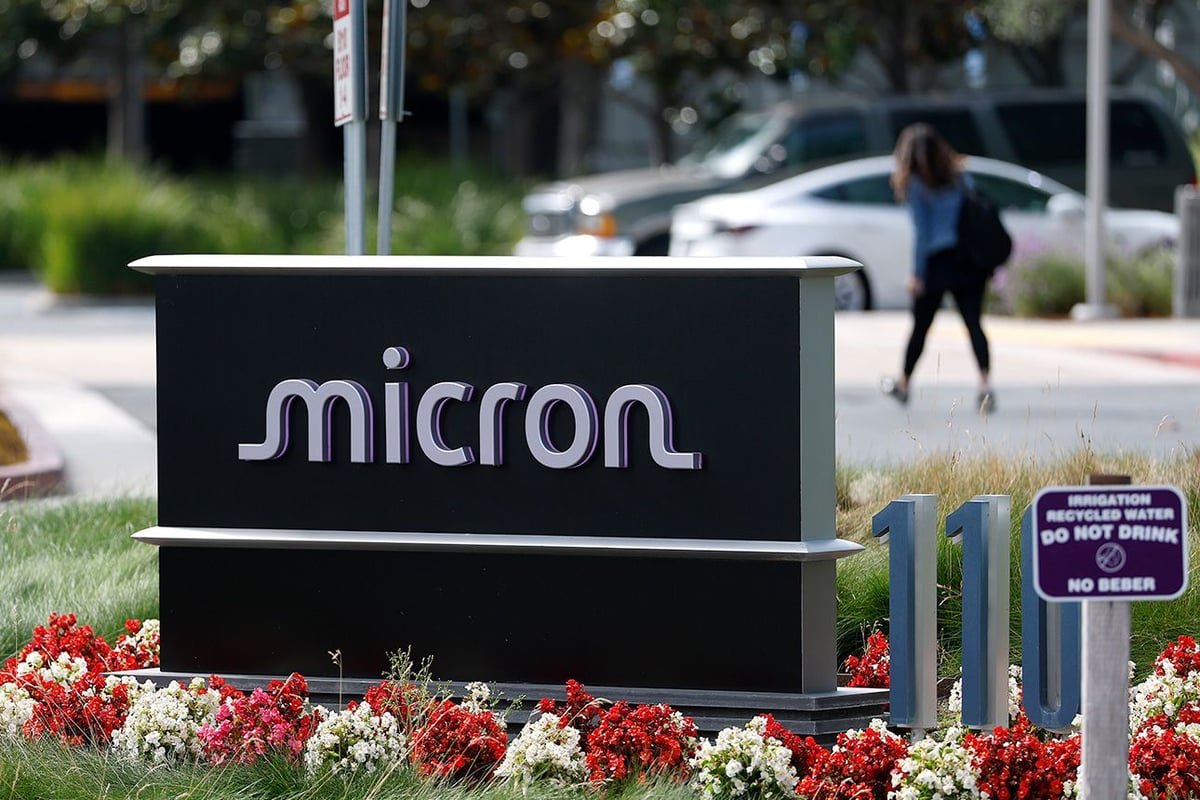
Micron Technology Shares Drop Amid AI Spending Concerns

Jim Cramer Increases Stake in GE Vernova Shares
Micron Technology, Inc. provides memory and storage solutions. The Company delivers a portfolio of high-performance dynamic random-access memory (DRAM), NAND, and NOR memory and storage products through its Micron and Crucial brands. The Company's products enable advancing in artificial intelligence (AI) and compute-intensive applications. Its segments include Cloud Memory Business Unit (CMBU), Core Data Center Business Unit (CDBU), Mobile and Client Business Unit (MCBU) and Automotive and Embedded Business Unit (AEBU). CMBU is focused on memory solutions for large hyperscale cloud customers, and high bandwidth memory (HBM) for all data center customers. CDBU is focused on memory solutions for mid-tier cloud, enterprise, and OEM data center customers and storage solutions for all data center customers. MCBU is focused on memory and storage solutions for mobile and client segments. AEBU is focused on memory and storage solutions for the automotive, industrial, and consumer segments. It operates in the Technology sector (SEMICONDUCTORS & RELATED DEVICES industry).
Micron Technology Inc is a good buy right now due to its strong financial performance and positive catalysts. The stock's current price is $878.84, with a forward P/E ratio of 7.0175, indicating it is undervalued compared to its earnings potential. Additionally, the gross margin has reached an impressive 86.76% in the latest quarter, reflecting robust profitability. However, the main risk is the RSI at 19.671, indicating the stock is oversold and may face short-term volatility.
31 analysts cover MU: 28 rate it Buy, 3 Hold and 0 Sell. The average price target is 336.12.

BTC has fallen below $81,000—don't rush to call it a bear market! This candlestick holds clues for a countermove. Bitcoin dropping below $81,000 immediately raises the question: who is left to buy? Some are busy turning bearish, others are looking for support, while the candlestick quietly says: hold on, let's see the close first. From the daily structure, BTC rallied and then pulled back, with the short-term rebound failing to hold higher levels, indicating selling pressure above remains. If the bearish candle body expands and volume rises in tandem, it suggests sellers are more aggressive; if price dips and leaves a clear long lower wick, it indicates possible buying interest at lower levels. Key focus is the $80,000–$81,250 zone. This is an important area to watch for buyers' defense, but support is not a safe deposit box—you can't assume it will hold just because the number looks good. If price reclaims the $82,000–$84,000 range with improving volume, the short-term structure may gradually repair. Conversely, if price breaks below $80,000 on heavy volume and the bounce lacks strength, be cautious of further pullback. What's truly worth watching is not a single bullish candle, but a combination of higher lows, pullbacks that hold, and breakouts with volume. The market never lacks stories—what it lacks is confirmation signals. You can be confident in a bullish view, but trading still requires discipline. Do you think BTC will reclaim $82,000 first, or continue testing $80,000? Rational discussion welcome! $MU #BTC跌破81000美元
Show more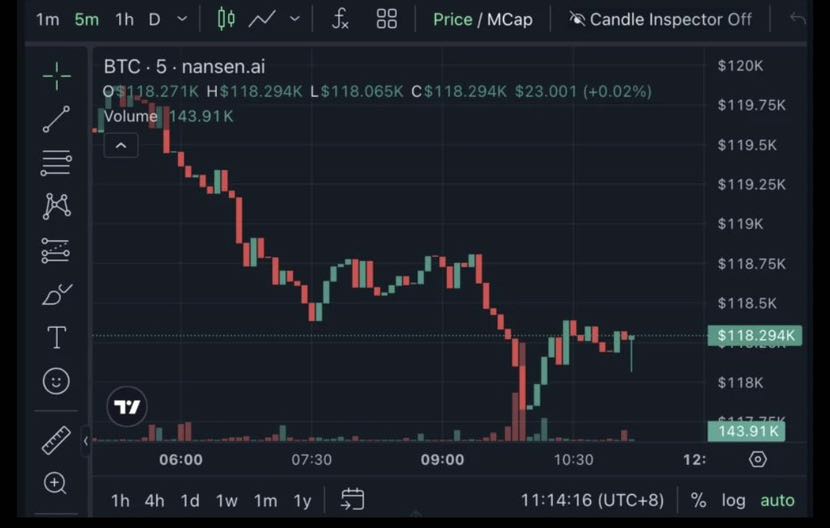

Earnings season is the real test—and the divergence between AI and crypto is just beginning. The overnight rebound looks good, but in the coming weeks the market will switch to a different yardstick: from sentiment-driven pricing to earnings-driven pricing. Of the 47 S&P 500 companies that have reported Q3 results so far, 85% have beaten expectations, and the index's overall earnings growth rate is on track to reach 29%. The key point, though, is that most tech companies have yet to report, and expectations for them are extremely high. The chief investment officer of LNW put it precisely: the market isn't worried about a valuation bubble but about an earnings-expectation bubble—share prices already embed high growth assumptions, and companies must deliver hard numbers to prove they deserve that pricing. That means the divergence ahead will be sharp. Albahary's observation is that AI headlines used to lift most AI-related stocks together, but that uniform move will disappear, and winners and losers will separate clearly. Some AI beneficiaries with real revenue support will keep strengthening, while the new cloud platforms that took on huge debt to build infrastructure may be sold off under cash-flow pressure. Crypto-related equities face a similar test. COIN's path depends on whether trading activity can keep recovering after Bitcoin returns to $84,000, not on a one-day sentiment spike. MSTR's test is whether financing costs and the mNAV premium can sustain its accumulation flywheel. Michael Saylor's confident remarks can't change how Bitcoin volatility transmits to the share price—Strategy's balance sheet resilience in extreme conditions is the real anchor. Sameer Samana of Wells Fargo characterizes the current AI trade as a reality check rather than a full crash, but he also acknowledges the adjustment may not be over, especially with AI and data-center issues becoming politicized, pressure could extend past the midterm elections. So my read on the period ahead: short-term oversold repair can be participated in, but don't build positions on the assumption that the trend has already reversed. Earnings season will give clear signals—which AI companies have real revenue, and which crypto-related equities have fundamentals supporting their elasticity. Until then, controlling position size matters more than picking the right direction. #WeeklyCheckIn #USStocksAIandCryptoConceptsRise $MU
Show more


$CL long position core entry rationale: Fundamentals: The geopolitical stalemate with Iran combined with falling U.S. crude inventories sets a "macro bullish" tone. Capital flows: Net inflow over the 7-day long cycle exceeded 130 million, while the short cycle saw outflows, interpreted as major players "washing out longs." $SPCX $MU
Show more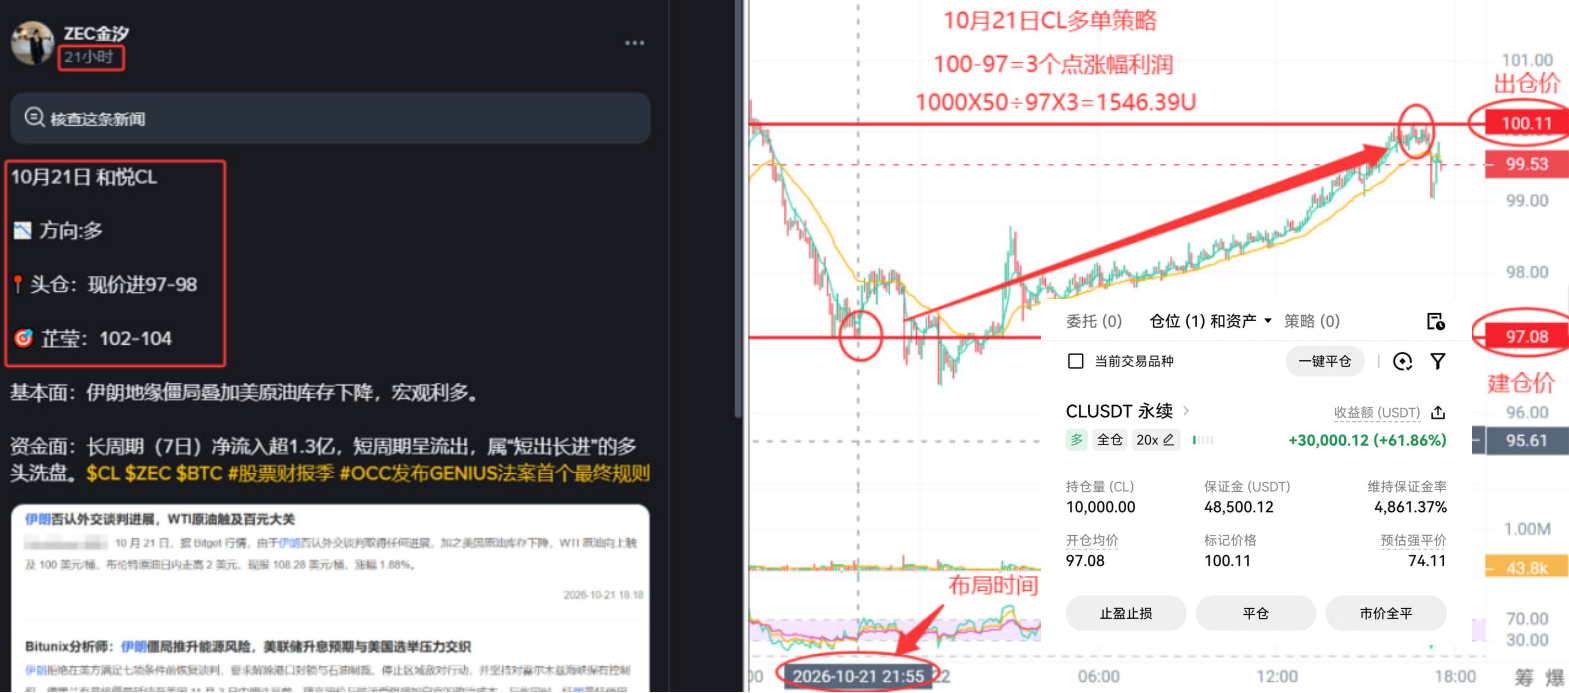

This page is for research only and is not investment advice. Models can be wrong. Past performance does not guarantee future results.