
B
Bull
Bull · 25%LEN.B
$95.73
Scenario price
$81.400
-0.855 (-1.05%)At close
Lennar Corporation is a homebuilder and an originator of residential and commercial mortgage loans. The Company is a provider of title insurance and closing services and a developer of multifamily rental properties. Its segments include Homebuilding, Financial Services, Multifamily, and Lennar Other. The Homebuilding segment primarily includes the construction and sale of single-family attached and detached homes, as well as the purchase, development and sale of residential land directly and through the Company's unconsolidated entities. The Financial Services segment primarily provides mortgage financing, title and closing services primarily for buyers of our homes, as well as property and casualty insurance. The Multifamily segment focuses on developing a geographically diversified portfolio of institutional multifamily rental properties in select United States markets. The Lennar Other segment includes fund investments.
Lennar Corporation Class B is currently trading at $84.95, which is below its 200-day simple moving average of $94.735, indicating a bearish trend. The RSI is at 49.788, suggesting the stock is neither overbought nor oversold. However, the forward P/E ratio is 13.1234, which is relatively low compared to industry averages, indicating potential value. The main risk is the significant decline in net income, which dropped to $299,696,000 in Q2 2026 from $1,151,782,000 in Q3 2024, reflecting ongoing challenges in the housing market.
Scenario prices are the last monthly forecast band of the current year. Probabilities are fixed model weights (25 / 50 / 25), not guarantees.

LENNAR CORP PLANS TO LAUNCH MORE THAN 40 NEW COMMUNITIES IN THE NORTHEAST BY 2026

Builder Stocks Surge as Cease-Fire Signals Potential Turnaround After Challenging Year.
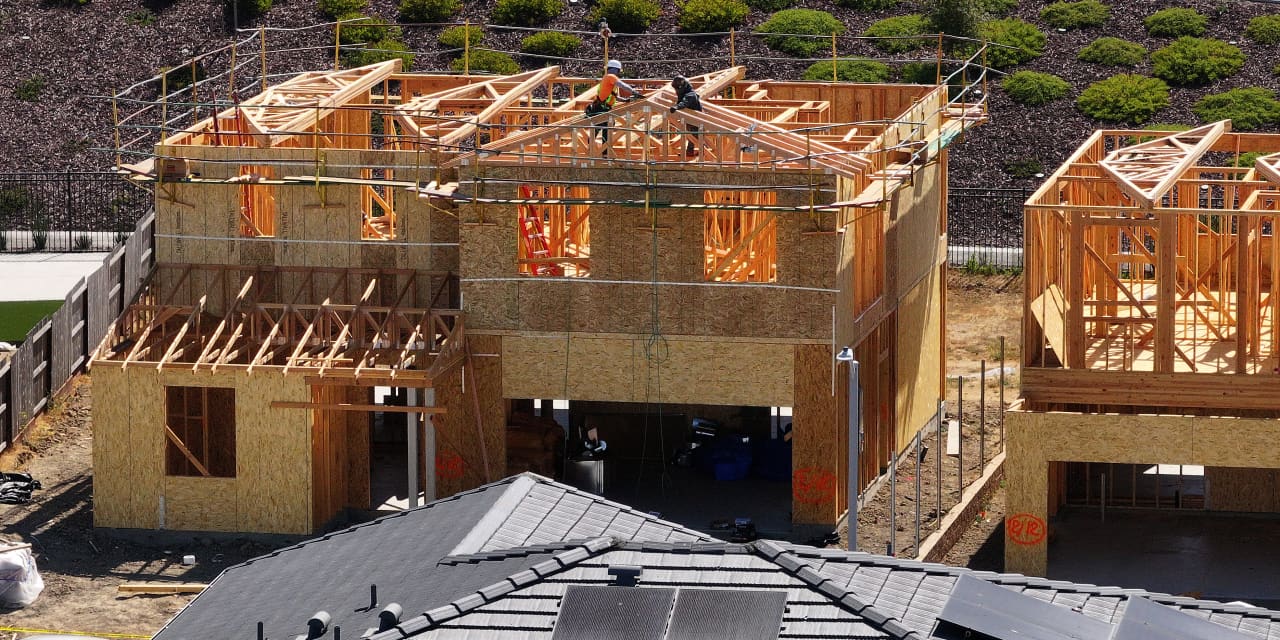
KB Home's Updated Projections Weigh Down Builder Stocks, But the Situation May Not Be as Dire as It Seems.

Trump Signs Housing Orders, But Investors Seek Additional Opportunities.

Stocks Decline Due to Oil Prices; Mild Inflation Fails to Provide Support.
Lennar Corporation is a homebuilder and an originator of residential and commercial mortgage loans. The Company is a provider of title insurance and closing services and a developer of multifamily rental properties. Its segments include Homebuilding, Financial Services, Multifamily, and Lennar Other. The Homebuilding segment primarily includes the construction and sale of single-family attached and detached homes, as well as the purchase, development and sale of residential land directly and through the Company's unconsolidated entities. The Financial Services segment primarily provides mortgage financing, title and closing services primarily for buyers of our homes, as well as property and casualty insurance. The Multifamily segment focuses on developing a geographically diversified portfolio of institutional multifamily rental properties in select United States markets. The Lennar Other segment includes fund investments. It operates in the Consumer Cyclicals sector.
Lennar Corporation Class B is currently trading at $84.95, which is below its 200-day simple moving average of $94.735, indicating a bearish trend. The RSI is at 49.788, suggesting the stock is neither overbought nor oversold. However, the forward P/E ratio is 13.1234, which is relatively low compared to industry averages, indicating potential value. The main risk is the significant decline in net income, which dropped to $299,696,000 in Q2 2026 from $1,151,782,000 in Q3 2024, reflecting ongoing challenges in the housing market.
This page is for research only and is not investment advice. Models can be wrong. Past performance does not guarantee future results.