
B
Bull
Bull · 25%LBRT
$12.44
Scenario price
$16.600
-0.100 (-0.60%)At close
Liberty Energy Inc. is an energy services company. The Company is a provider of completion services and technologies to onshore oil, natural gas, and enhanced geothermal energy producers in North America. It also owns and operates Liberty Power Innovations LLC, providing advanced distributed power and energy storage solutions for the commercial and industrial, data center, energy, and mining industries. It provides hydraulic fracturing services and related technologies to onshore oil and natural gas exploration and production (E&P) companies. It offers customers hydraulic fracturing services, together with complementary services including wireline services, proppant delivery solutions, field gas processing and treating, compressed natural gas (CNG) delivery, data analytics, related goods (including its sand mine operations), and technologies to facilitate lower emission completions. The Company's areas of operation are in all the active shale basins in North America.
Liberty Energy is currently not a strong buy due to its low RSI of 18.33, indicating oversold conditions, and a significant 12.63% decline over the past five days. However, the stock has shown a 52% increase over the past year, suggesting potential for recovery. The main risk is the forward P/E ratio of 29.50, which indicates high valuation expectations.
UBS
$31
2026-09-30
UBS
2026-09-30
Price Target
$31
Citi
—
2026-09-30
Citi
2026-09-30
Price Target
—
Barclays
$27
2026-09-28
Barclays
2026-09-28
Price Target
$27
UBS
$35
2026-09-14
UBS
2026-09-14
Price Target
$35
Piper Sandler
$30
2026-08-27
Piper Sandler
2026-08-27
Price Target
$30
Scenario prices are the last monthly forecast band of the current year. Probabilities are fixed model weights (25 / 50 / 25), not guarantees.

Liberty Energy to Release Q3 2026 Financial Results

JPMorgan Updates October Investment Recommendations Amid Mixed Market Performance
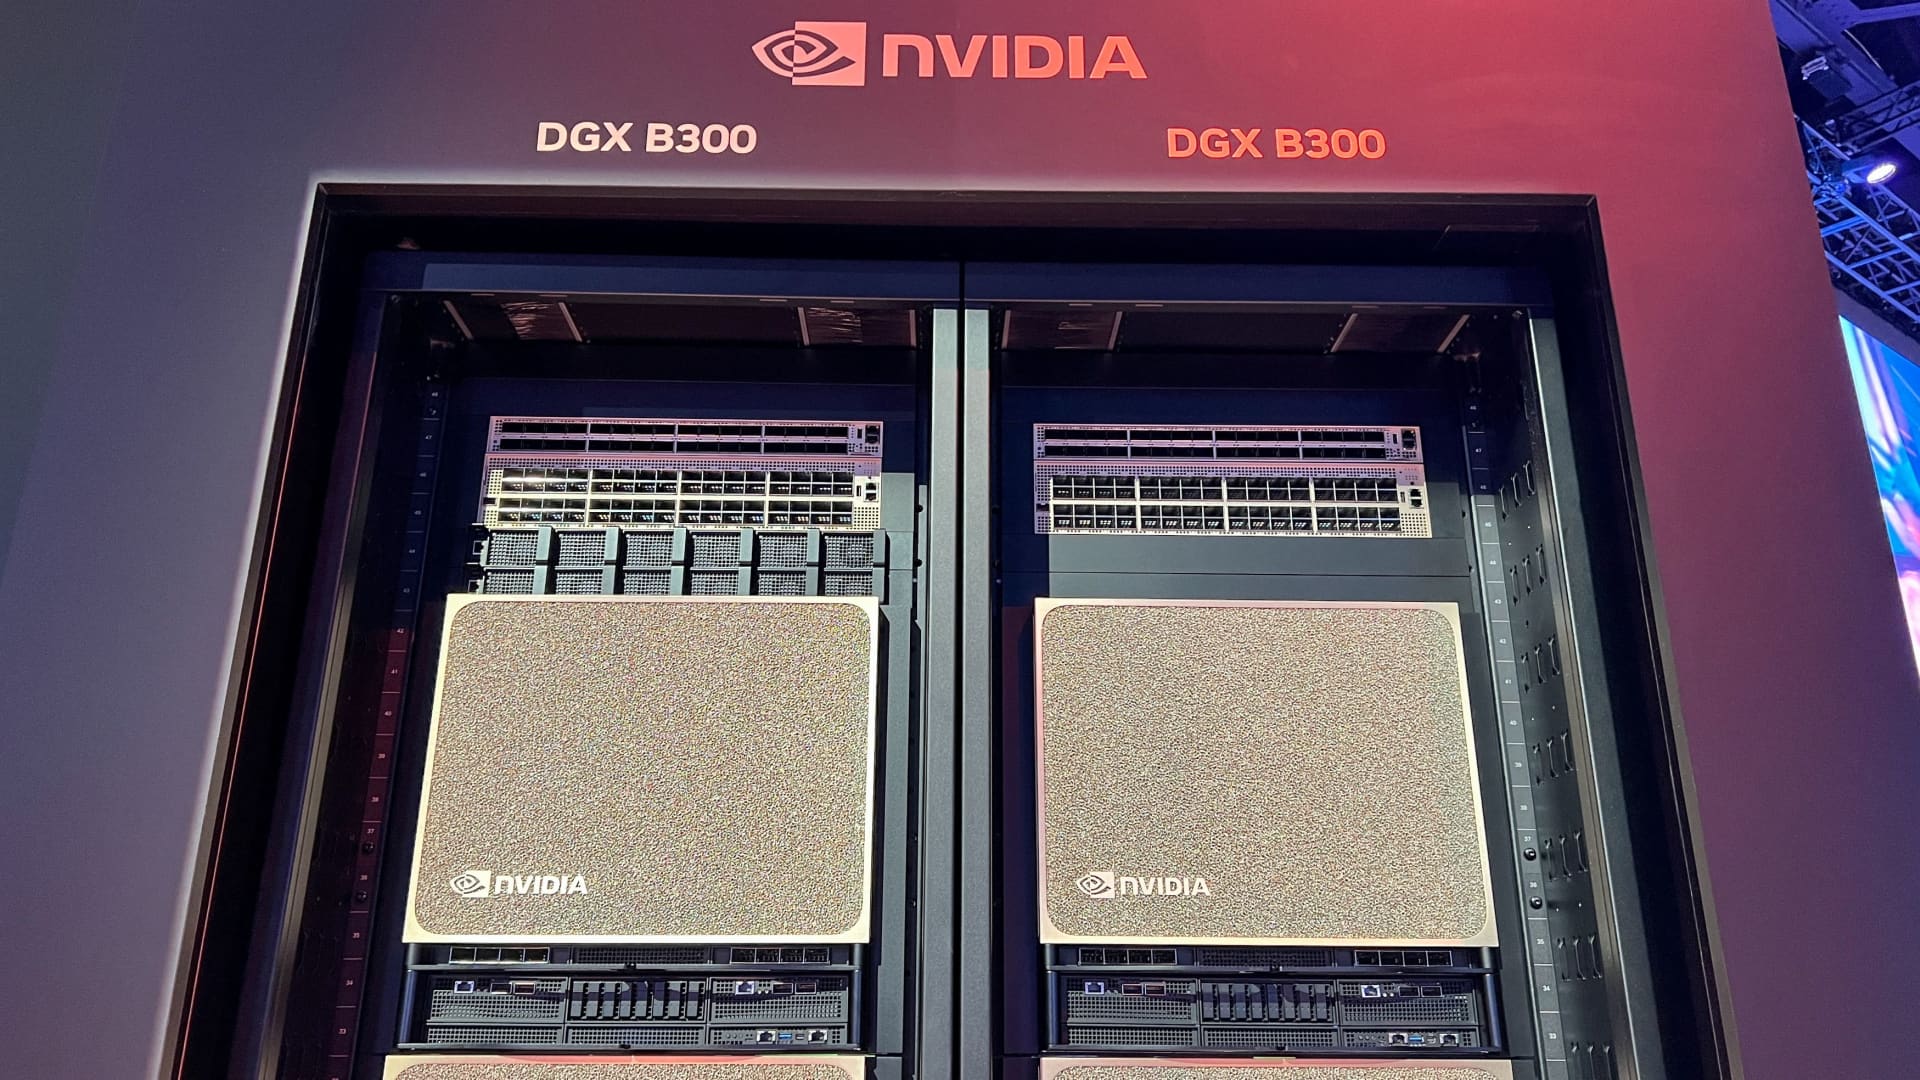
Key Wall Street Calls on Monday

U.S. Chamber Warns Trump Against Diesel Export Ban

Diesel Export Ban May Exacerbate Global Fuel Crisis
Liberty Energy Inc. is an energy services company. The Company is a provider of completion services and technologies to onshore oil, natural gas, and enhanced geothermal energy producers in North America. It also owns and operates Liberty Power Innovations LLC, providing advanced distributed power and energy storage solutions for the commercial and industrial, data center, energy, and mining industries. It provides hydraulic fracturing services and related technologies to onshore oil and natural gas exploration and production (E&P) companies. It offers customers hydraulic fracturing services, together with complementary services including wireline services, proppant delivery solutions, field gas processing and treating, compressed natural gas (CNG) delivery, data analytics, related goods (including its sand mine operations), and technologies to facilitate lower emission completions. The Company's areas of operation are in all the active shale basins in North America. It operates in the Energy sector (OIL & GAS FIELD SERVICES, NEC industry).
Liberty Energy is currently not a strong buy due to its low RSI of 18.33, indicating oversold conditions, and a significant 12.63% decline over the past five days. However, the stock has shown a 52% increase over the past year, suggesting potential for recovery. The main risk is the forward P/E ratio of 29.50, which indicates high valuation expectations.
9 analysts cover LBRT: 8 rate it Buy, 1 Hold and 0 Sell. The average price target is 18.91.
No posts yet
Sign up or log in to join the discussionThis page is for research only and is not investment advice. Models can be wrong. Past performance does not guarantee future results.