B
Bull
Bull · 25%GS
$896.75
Scenario price
$891.910
-2.051 (-0.23%)At close
The Goldman Sachs Group, Inc. is a global financial institution that delivers a range of financial services to a large and diversified client base that includes corporations, financial institutions, governments and individuals. Its segments include Global Banking & Markets, Asset & Wealth Management and Platform Solutions. The Global Banking & Markets segment offers a range of services, including financing, advisory services, risk distribution, and hedging for its institutional and corporate clients. It facilitates client transactions and makes markets in fixed income, equity, currency and commodity products. The Asset & Wealth Management segment manages assets and offers investment products across all asset classes to a diverse set of clients. It also provides investing and wealth advisory solutions. The Platform Solutions segment includes consumer platforms, such as partnerships offering credit cards and point-of-sale financing, and transaction banking and other platform businesses.
Goldman Sachs appears to be a good buy right now, trading at $895.32, which is significantly below the analyst price target of $1,050 set by TD Cowen. The stock has a forward P/E ratio of 12.80, indicating it is undervalued compared to its growth potential. However, the main risk is its RSI of 39.69, suggesting it is in a bearish trend and may continue to face downward pressure in the short term.
TD Cowen
$1050
2026-10-08
TD Cowen
2026-10-08
Price Target
$1050
TD Cowen
$1050
2026-10-07
TD Cowen
2026-10-07
Price Target
$1050
BMO Capital
$970
2026-10-06
BMO Capital
2026-10-06
Price Target
$970
BofA
—
2026-10-05
BofA
2026-10-05
Price Target
—
UBS
—
2026-10-05
UBS
2026-10-05
Price Target
—
Scenario prices are the last monthly forecast band of the current year. Probabilities are fixed model weights (25 / 50 / 25), not guarantees.
Major Banks' Service Decisions Influenced by Political Factors, OCC Report Reveals
US Stocks Decline Due to Inflation Data
September CPI Exceeds Expectations, Bank Earnings Flood In
Morgan Stanley Reports Strong Q3 Earnings Exceeding Expectations
Morgan Stanley's Q3 Earnings Outlook Highlights
The Goldman Sachs Group, Inc. is a global financial institution that delivers a range of financial services to a large and diversified client base that includes corporations, financial institutions, governments and individuals. Its segments include Global Banking & Markets, Asset & Wealth Management and Platform Solutions. The Global Banking & Markets segment offers a range of services, including financing, advisory services, risk distribution, and hedging for its institutional and corporate clients. It facilitates client transactions and makes markets in fixed income, equity, currency and commodity products. The Asset & Wealth Management segment manages assets and offers investment products across all asset classes to a diverse set of clients. It also provides investing and wealth advisory solutions. The Platform Solutions segment includes consumer platforms, such as partnerships offering credit cards and point-of-sale financing, and transaction banking and other platform businesses. It operates in the Financials sector (SECURITY BROKERS, DEALERS & FLOTATION COMPANIES industry).
Goldman Sachs appears to be a good buy right now, trading at $895.32, which is significantly below the analyst price target of $1,050 set by TD Cowen. The stock has a forward P/E ratio of 12.80, indicating it is undervalued compared to its growth potential. However, the main risk is its RSI of 39.69, suggesting it is in a bearish trend and may continue to face downward pressure in the short term.
27 analysts cover GS: 10 rate it Buy, 15 Hold and 2 Sell. The average price target is 951.45.


✨ Earnings season has begun: profit growth and mixed expectations side by side. 🔹 Q3 results from U.S. banks have started to roll in. Data from JPMorgan, Goldman Sachs, and Wells Fargo provide key signals for the sector's overall outlook. 📊 Reported data: 🔹 JPMorgan Chase: net profit rose 6% to $15.3 billion. EPS was $5.57, below the expected $5.90. Weak interest-related revenue drew attention. 🔹 Goldman Sachs: net profit jumped 29% to $5.29 billion. EPS reached $17.01, well above the expected $12.53. Annualized return on equity was 18.7%. 🔹 Wells Fargo: net profit rose to $6 billion, above expectations. EPS was $1.87, above the forecast of $1.84. However, revenue came in below expectations at $21.87 billion. ⚖️ Structural view: These bank results reflect how they are navigating the rate environment and capital market activity. Goldman Sachs' strong performance suggests investment banking and trading revenue are recovering, while weakness in JPMorgan's lending business indicates that market dynamics are squeezing profitability in some areas. Meanwhile, slower revenue growth at Wells Fargo shows that net interest margin pressure remains. These results can serve as a reference point for other alternatives to be announced later in this earnings season. 💬 On bank policy, do you mainly focus on profit growth or revenue quality? 👇 #BankEarnings #JPMorgan #GoldmanSachs #WellsFargo #Macro Not financial advice.
Show more

$GS | THE GOLDMAN SACHS GROUP, INC. Q3 2026 EARNINGS HIGHLIGHTS ◆ EPS: $17.01 vs. $12.86 est. ✅ ◆ Revenue: $18.68B vs. $16.83B est. ✅ ◆ Net Interest Income: $3.77B (-2.0% YoY) ◆ Net Income: $5.29B (+29.2% YoY) ◆ Provision for Credit Losses: $368M (+8.6% YoY) ◆ Non-Interest Expense: $11.31B (+19.6% YoY) Segment Performance: ◆ Global Banking & Markets: $13.46B (+32% YoY) ◆ Asset & Wealth Management: $5.05B (+14% YoY) ◆ Platform Solutions: $170M (-72% YoY) Key Metrics: ◆ Equities revenue surged 72% YoY to $6.44B, driven by prime financing and derivatives strength. ◆ Investment banking fees rose 21% YoY to $3.22B; IB fees backlog decreased vs. end of Q2 2026. ◆ Total assets under supervision reached $4.10T at quarter-end, up from $3.45T a year ago. Forward Guidance: ◆ No guidance provided
Show more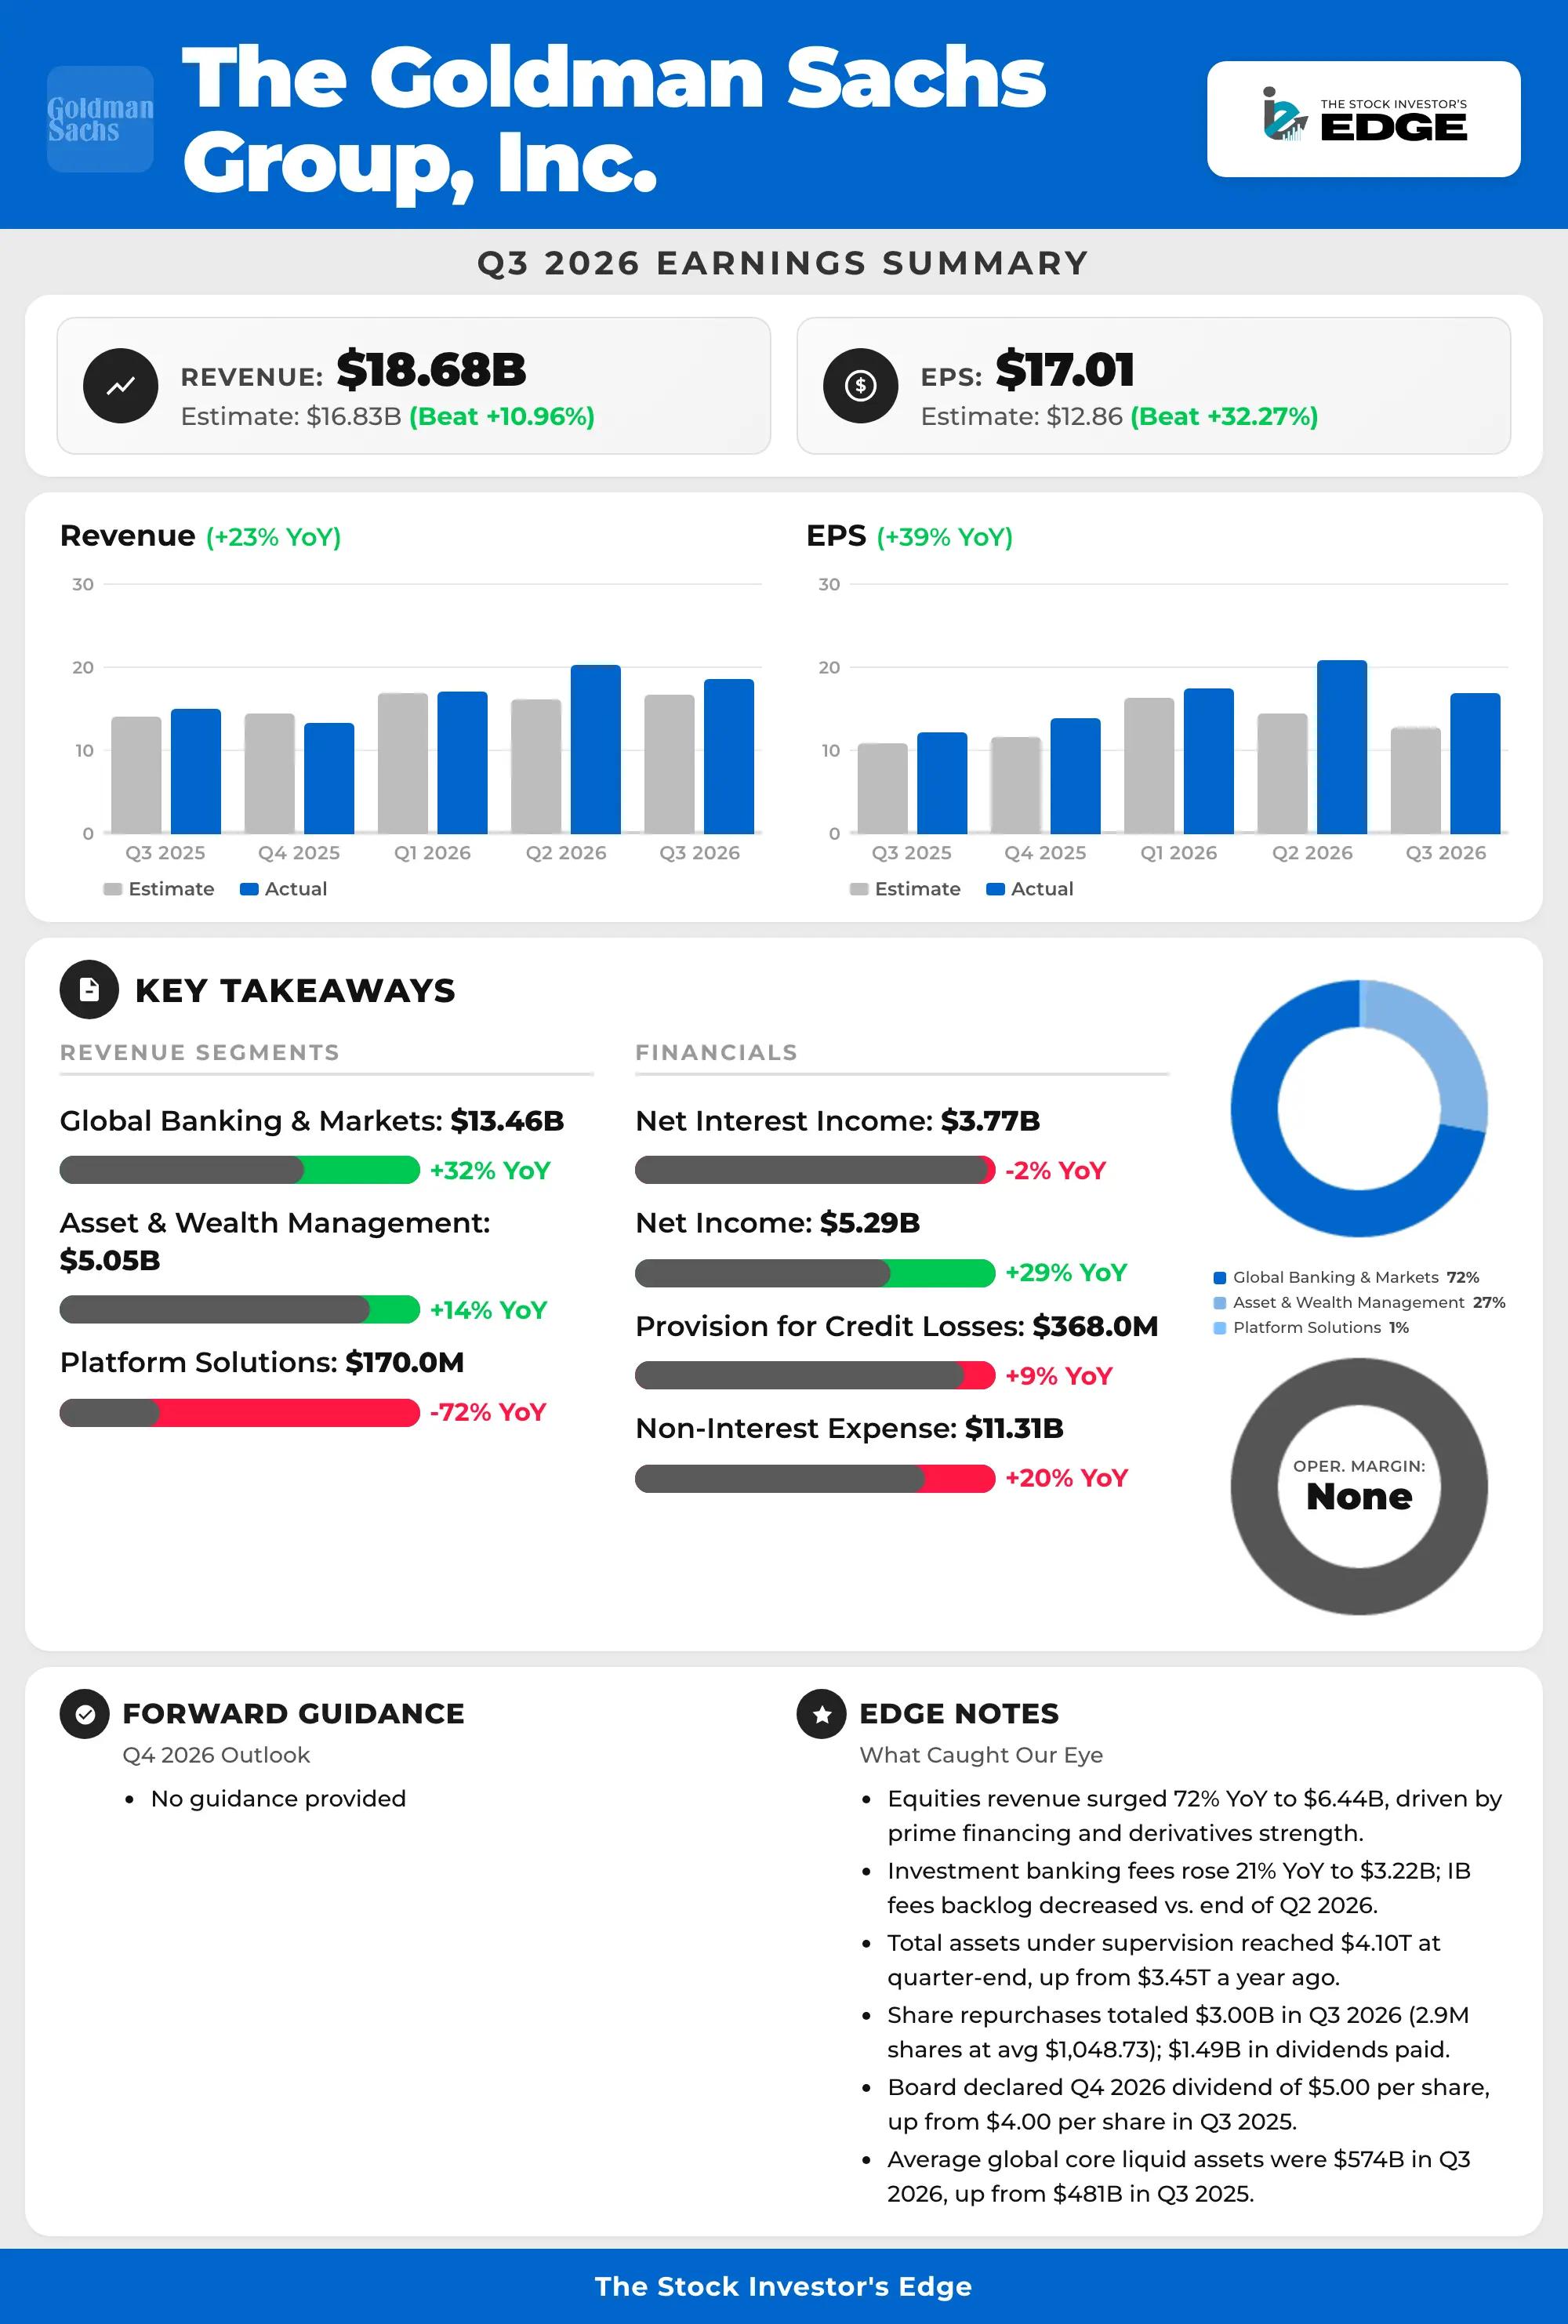

Wall Street is already on-chain. BlackRock, Fidelity, Franklin Templeton, JPMorgan, Goldman Sachs, Citi, HSBC, UBS, Visa, Mastercard, PayPal, and more. Thirty financial giants have already launched tokenized assets or stablecoins. Do you still think RWA is just a narrative?
Show more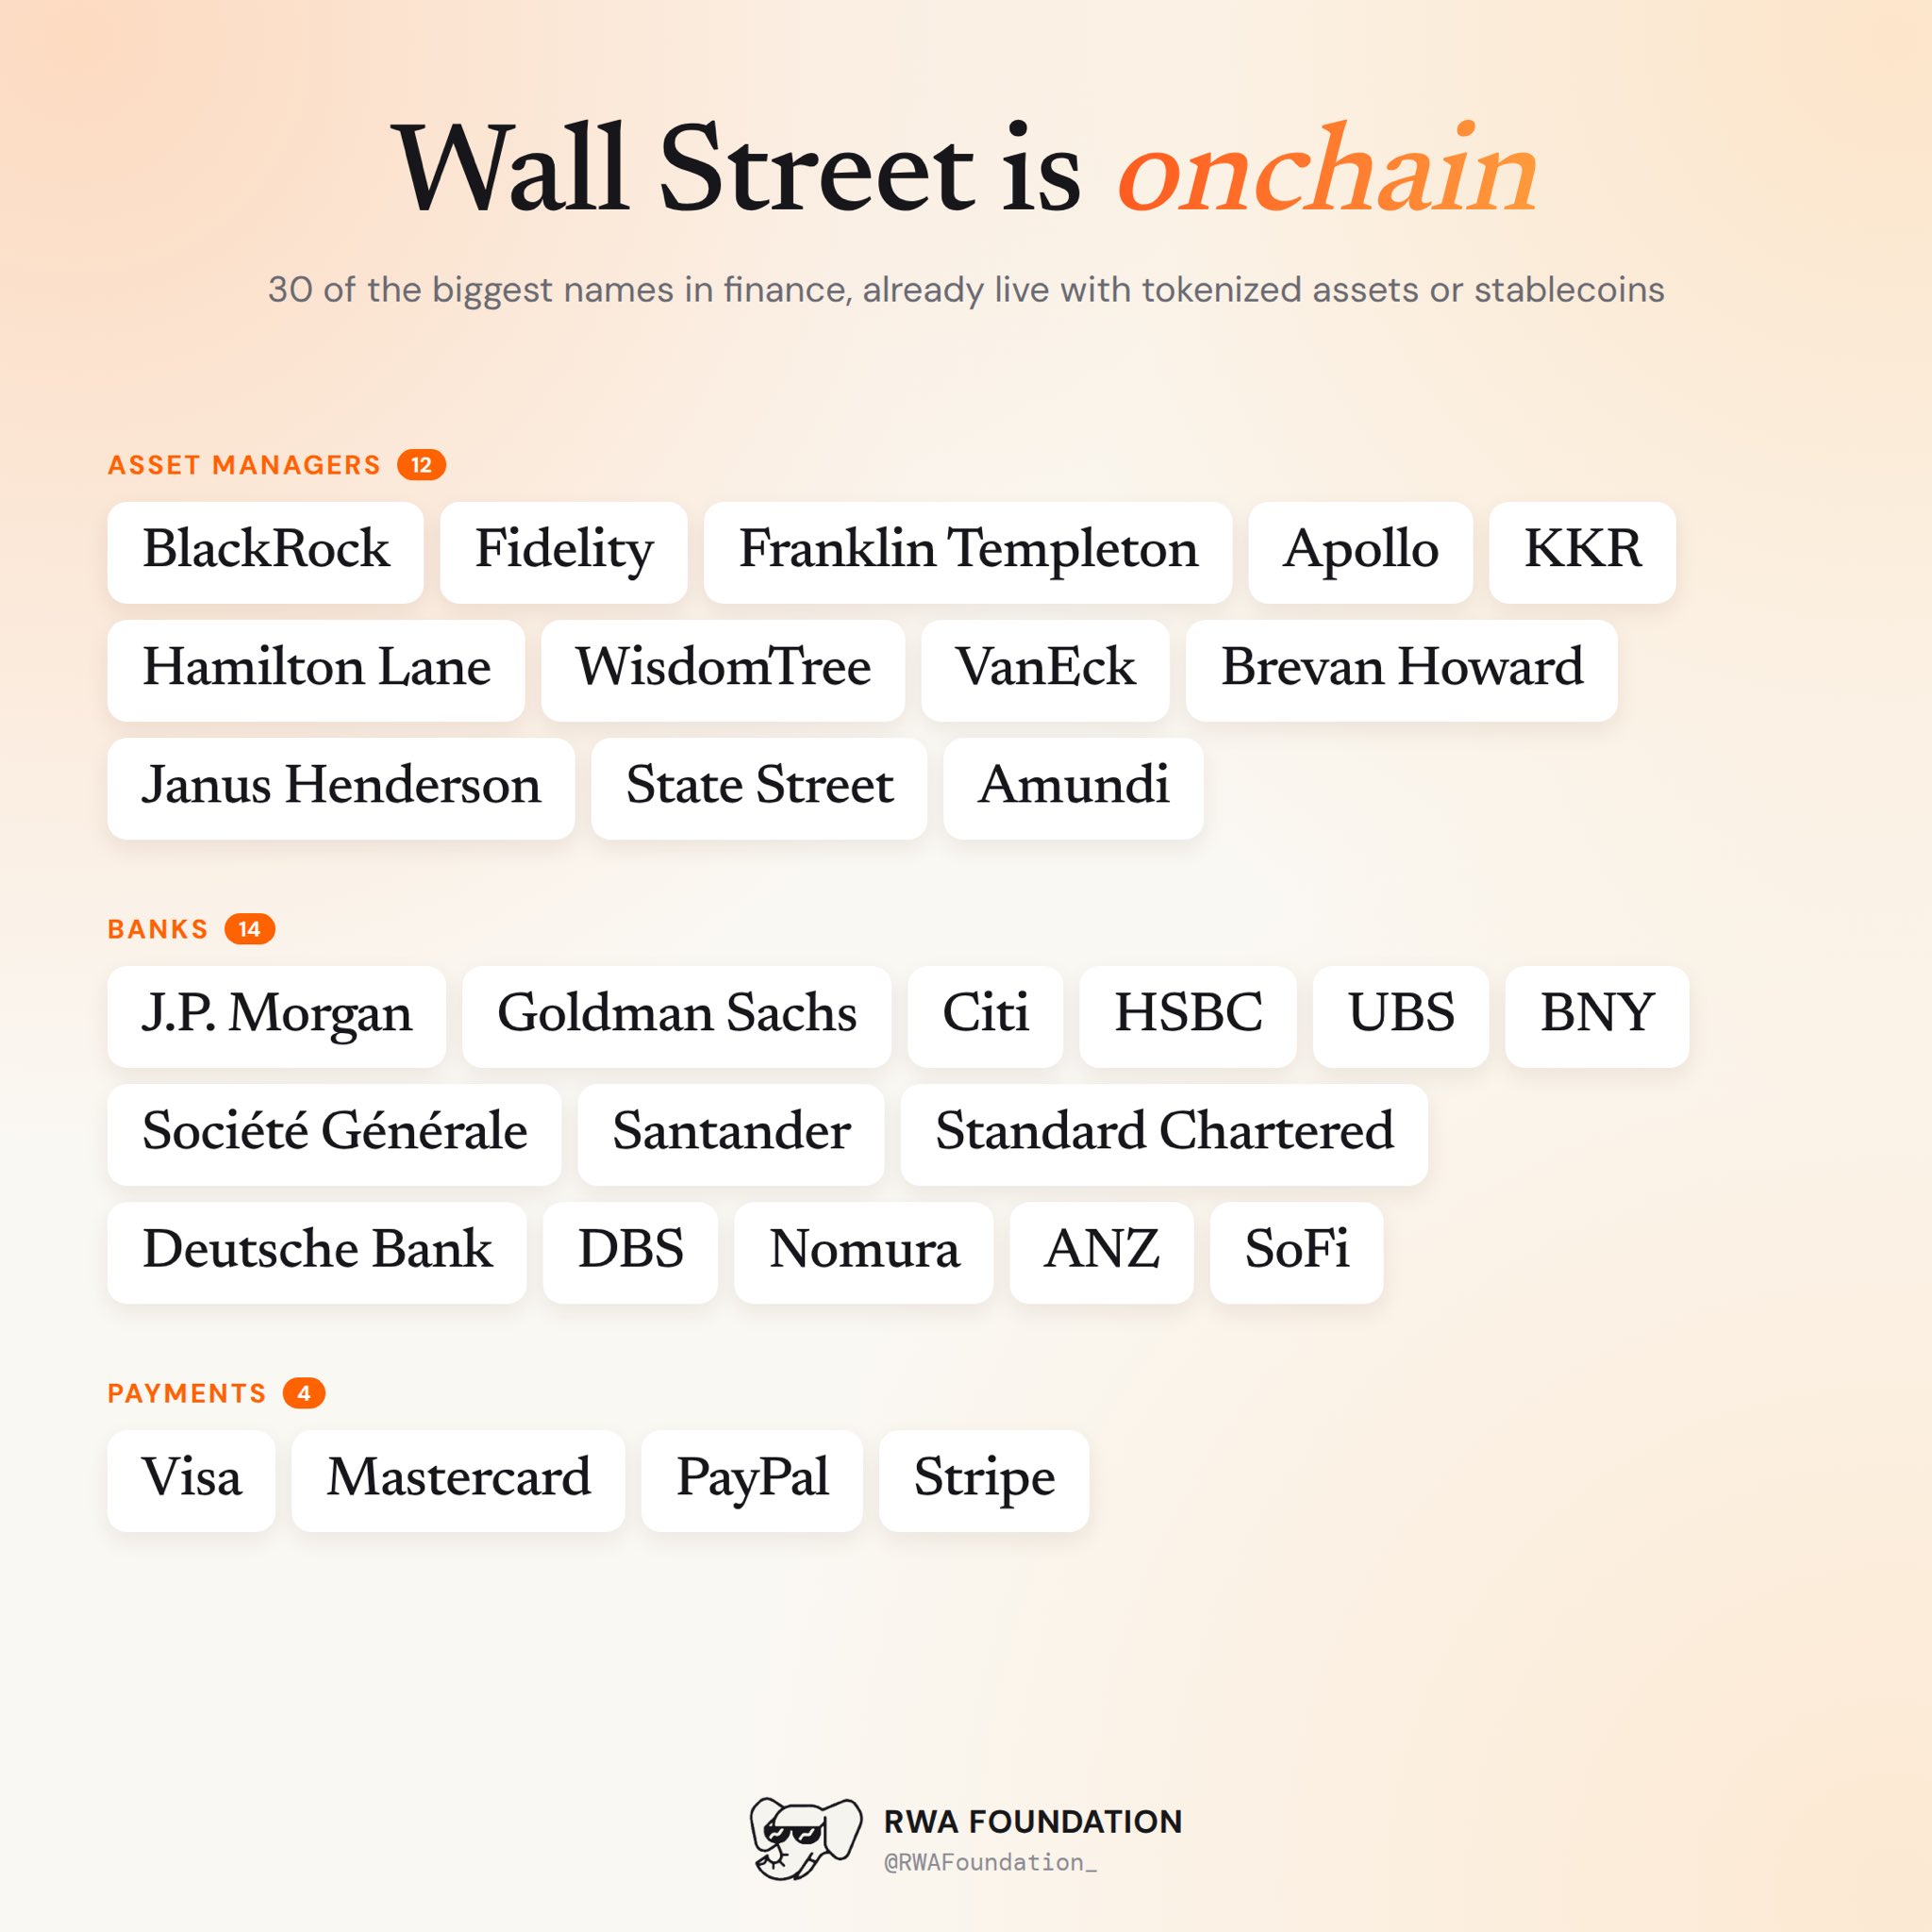

This page is for research only and is not investment advice. Models can be wrong. Past performance does not guarantee future results.