
B
Bull
Bull · 25%FET
$19.77
Scenario price
$87.170
+5.997 (+6.88%)At close
Forum Energy Technologies, Inc. is a global manufacturing company serving the oil, natural gas, industrial and renewable energy industries. Its segments include Drilling and Completions, and Artificial Lift and Downhole. The Drilling and Completions segment designs, manufactures and supplies products and solutions to the drilling, subsea, coiled tubing, well stimulation and intervention markets, including applications in the oil and natural gas, renewable energy, defense and communications industries. The products and solutions include capital equipment and consumable products, wireline cable and pressure control equipment, and coiled tubing strings and pressure control equipment. The Artificial Lift and Downhole segment designs, manufactures and supplies products and solutions for the artificial lift, well construction, production and infrastructure markets. Its products include well construction casing and cementing equipment, customized downhole technology solutions, and others.
Forum Energy Technologies Inc is a good buy right now due to its recent strong performance, with a current price of 87.17 and a year-to-date change of 127.84%. The company's Q2 earnings showed a significant profit turnaround with an adjusted net income of 13.7 million, exceeding analyst expectations. Additionally, the forward P/E ratio stands at 22.83, indicating growth potential. The main risk is the high debt-to-equity ratio of 49.59%, which could impact financial stability if market conditions worsen.
Scenario prices are the last monthly forecast band of the current year. Probabilities are fixed model weights (25 / 50 / 25), not guarantees.

Forum Energy Technologies to Participate in Water Tower Research Virtual Conference
Forum Energy Technologies to Present at Investor Conference
Forum Energy Technologies CFO to Present at EnerCom Denver Conference

Forum Energy Technologies Reports Strong Q2 Earnings, Shares Surge

Forum Energy Technologies Reports Strong Q2 Earnings
Forum Energy Technologies, Inc. is a global manufacturing company serving the oil, natural gas, industrial and renewable energy industries. Its segments include Drilling and Completions, and Artificial Lift and Downhole. The Drilling and Completions segment designs, manufactures and supplies products and solutions to the drilling, subsea, coiled tubing, well stimulation and intervention markets, including applications in the oil and natural gas, renewable energy, defense and communications industries. The products and solutions include capital equipment and consumable products, wireline cable and pressure control equipment, and coiled tubing strings and pressure control equipment. The Artificial Lift and Downhole segment designs, manufactures and supplies products and solutions for the artificial lift, well construction, production and infrastructure markets. Its products include well construction casing and cementing equipment, customized downhole technology solutions, and others. It operates in the Energy sector (OIL & GAS FIELD MACHINERY & EQUIPMENT industry).
Forum Energy Technologies Inc is a good buy right now due to its recent strong performance, with a current price of 87.17 and a year-to-date change of 127.84%. The company's Q2 earnings showed a significant profit turnaround with an adjusted net income of 13.7 million, exceeding analyst expectations. Additionally, the forward P/E ratio stands at 22.83, indicating growth potential. The main risk is the high debt-to-equity ratio of 49.59%, which could impact financial stability if market conditions worsen.
20 analysts cover FET: 6 rate it Buy, 14 Hold and 0 Sell.

$FET is showing strong momentum within the macro descending channel on the weekly timeframe. A breakout is brewing, with the setup preparing for an explosive move toward higher targets.
Show more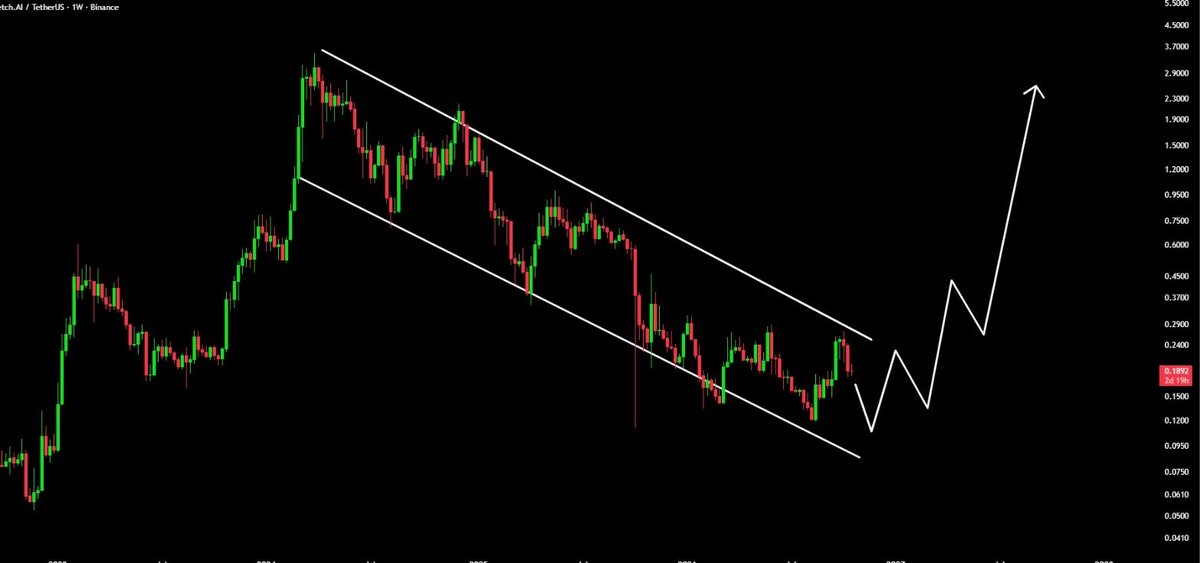

$FET FETUSD The bull cycle has started, with a target of up to $7.00. Artificial Superintelligence Alliance (FETUSD) may have pulled back in recent weeks, but it recently broke above the 1W MA50 (blue trendline) for the first time in nearly 2 years, so from a technical perspective its bear cycle appears to have ended. Its long-term pattern is an ascending channel, and the August low was very close to the bottom of that pattern. This formed a higher low within the pattern's buy zone (Fibonacci 0.0 - 0.236 range), while the previous two instances (November 21, 2022 and March 09, 2020) both ultimately became excellent bottom-buying opportunities in the prior two cycles. The 1W RSI has broken out and climbed significantly, consistent with previous bull cycles (bullish phases), and we expect the current cycle to repeat the upside pattern of those two. Both peaked at the top of the pattern's sell zone, slightly below their respective 1.382 Fibonacci extension levels (although the gains differed greatly, at +6431% and +33133% respectively). If FET rises "only" +6431% again, it would reach $7.00, still well below the projected 1.382 Fibonacci extension level. This is our long-term target. -- ** If you like this view, please like, follow ✅, share and comment ✍! Also share your views and charts in the comments below! This is the best way to keep the discussion active, support us, keep the content here free, and help as many people as possible see this view.**
Show more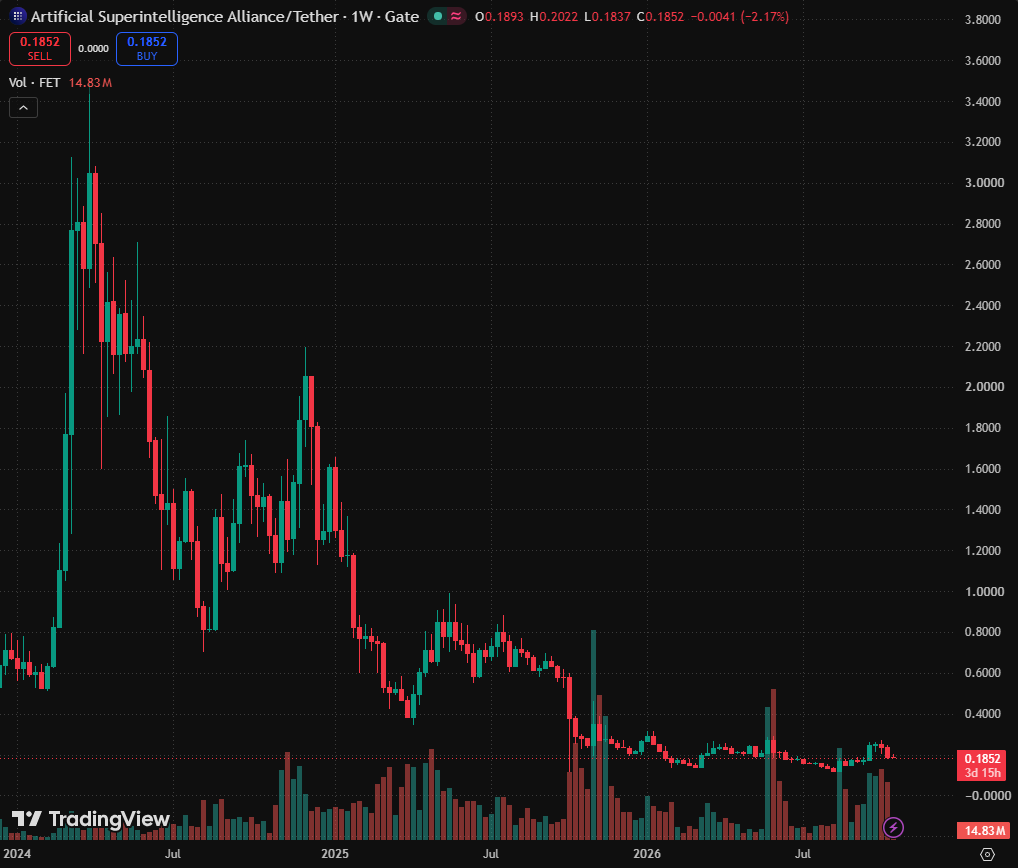

$ZRO is at 1.95, with resistance above at 2.00 and support below at 1.90, in a short-term oversold recovery window within a bearish structure. MA5=1.9506 remains below MA20=1.9993, and the bearish moving average alignment is unchanged, but price has pressed up against MA5, and downside momentum is slowing at the margin; the MACD histogram at -0.005299 remains negative, indicating a weak rebound rather than a reversal; RSI=37.3 is near the lower edge of the weak zone, and downside room is compressed; the lower Bollinger Band at 1.90029 is only a step away from the current price and forms the first support, while the middle band at 2.09831 is the natural resistance for a rebound. The funding rate of +0.0050% shows longs are still paying to hold positions, and with the Fear & Greed Index at 55 (Greed), shorting here is not attractive, so I lean toward playing a technical rebound near support. For action, I mainly favor buying low: entry reference 1.90–1.93, the confluence zone of the lower Bollinger Band and the round-number level, also close to the starting point of RSI oversold recovery; take-profit 1 at 2.00, corresponding to psychological resistance below MA20 and the moving-average mean-reversion level; take-profit 2 at 2.09, corresponding to the Bollinger middle band, also the last line of defense in the bearish structure; stop-loss at 1.86, exiting if price breaks below the lower Bollinger Band and confirms support failure, to avoid an accelerated downside move from moving averages. If price rebounds directly above 2.00 without sustained volume, I will give up chasing the long. Also watching: $ER +15.31% in 24h, RSI 83.8 already in overbought territory, relatively strong but with high risk in chasing; $FET RSI 30.2 is weak, lagging $ZRO's recovery pace. (Personal view, for reference only, and not investment advice. Futures risk is extremely high, so please strictly control position size.) Data: Pair: ZROUSDT Direction: Long Entry: 1.90-1.93 Take-profit 1: 2.00 Take-profit 2: 2.09 Stop-loss: 1.86
Show more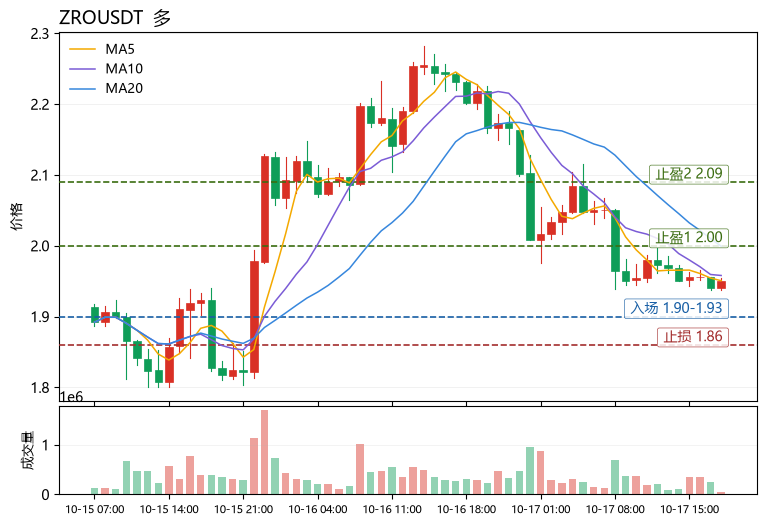

Interestingly, everyone likes how $FET performs above $3. But no one is willing to buy below $0.20. I think this is a coin worth watching closely. The real question is whether buyers will finally step in. $FET Dyor #TeslaQ3ProfitAndMargins
Show more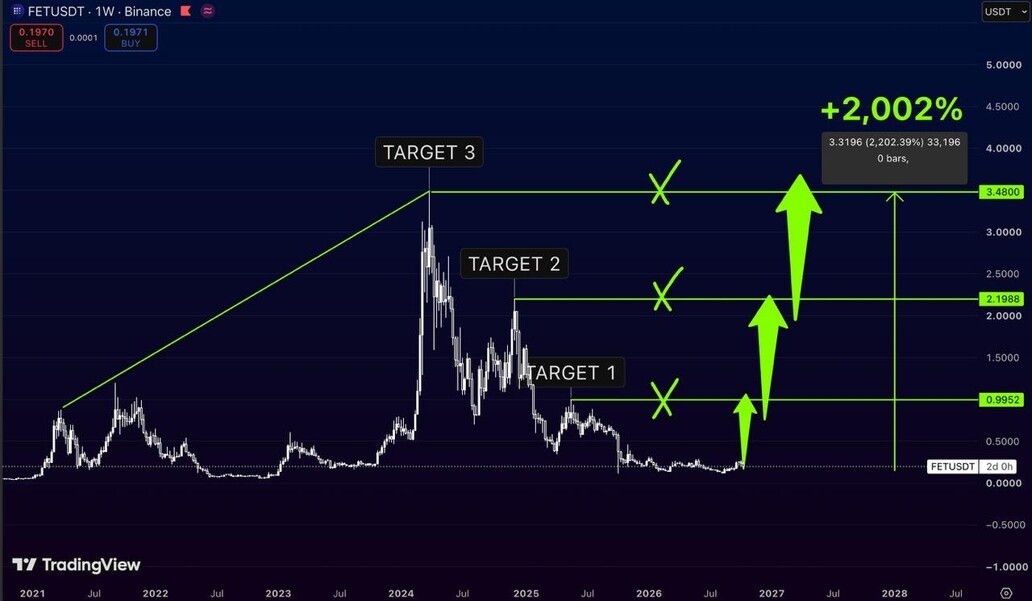

Ethereum: currently testing its 1D uptrend support and the major daily support zone at $0.18–0.20. As long as this range holds, $0.30–0.40 is the next target area. 📈 #FET #FETUSDT #FetchAi #Crypto #Alts
Show more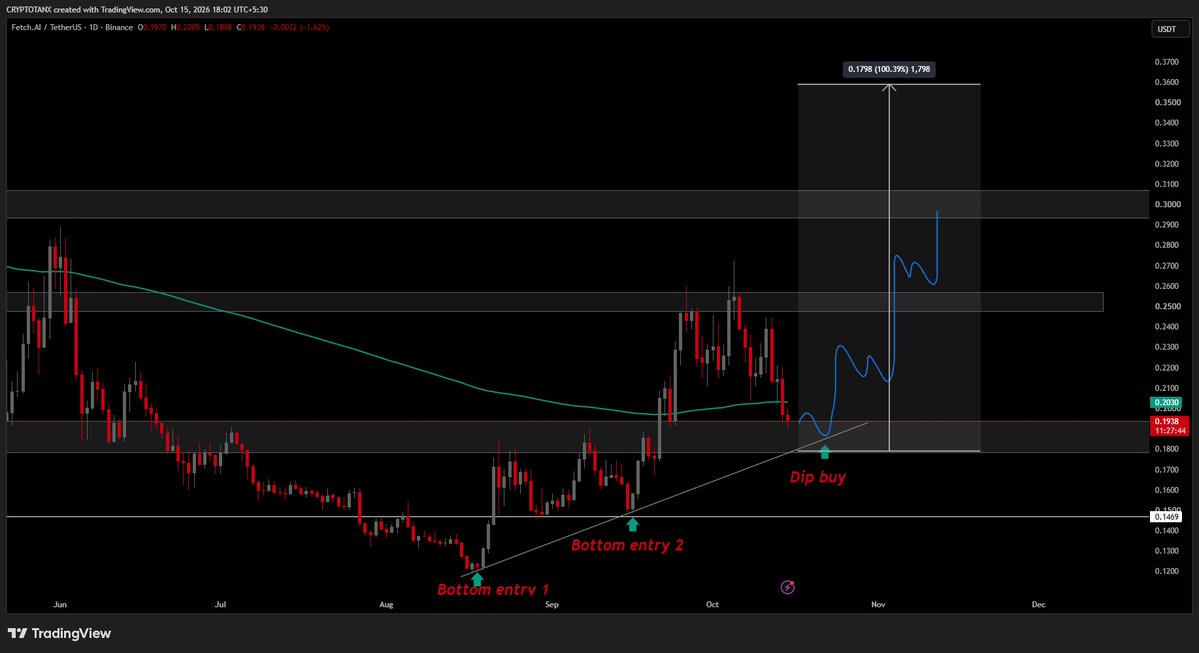
This page is for research only and is not investment advice. Models can be wrong. Past performance does not guarantee future results.