B
Bull
Bull · 25%DE
$467.75
Scenario price
$646.150
+2.520 (+0.39%)At close
Deere & Company is engaged in the delivery of agricultural, construction and forestry equipment. Its segments include production and precision agriculture (PPA), small agriculture and turf (SAT), construction and forestry (CF), and financial services (FS). PPA segment defines, develops and delivers global equipment and technology solutions for production-scale growers of large grains, small grains, cotton and sugarcane. SAT segment defines, develops and delivers global equipment and technology solutions for dairy and livestock producers, high-value and small acreage crop producers, and turf and utility customers. CF segment defines, develops and delivers a range of machines and technology solutions organized along the earthmoving, forestry and roadbuilding production systems. FS segment finances sales and leases by John Deere dealers of new and used production and precision agriculture equipment and others. Its products include John Deere Autonomous 8R Tractor and E-Power Backhoe.
Deere & Co is currently priced at $646.15, with a forward P/E of 29.33, which indicates that the stock is relatively expensive compared to its earnings potential. The RSI is at 51.90, suggesting that the stock is neither overbought nor oversold, which supports a hold position. The main risk is the insider selling activity, which has increased by 384.66% over the last month, indicating potential concerns among insiders about the company's future performance.
JPMorgan
$625
2026-10-08
JPMorgan
2026-10-08
Price Target
$625
CICC
$760
2026-09-13
CICC
2026-09-13
Price Target
$760
Evercore ISI
$813
2026-09-02
Evercore ISI
2026-09-02
Price Target
$813
Raymond James
$730
2026-08-31
Raymond James
2026-08-31
Price Target
$730
Baird
$800
2026-08-31
Baird
2026-08-31
Price Target
$800
Scenario prices are the last monthly forecast band of the current year. Probabilities are fixed model weights (25 / 50 / 25), not guarantees.

Caterpillar vs. Deere: A Competitive Analysis

Investor Perspectives on Multiple Stocks

FTC and USDA Launch Inquiry into Agricultural Equipment Market Practices
Week in Review: Trades and Market Dynamics

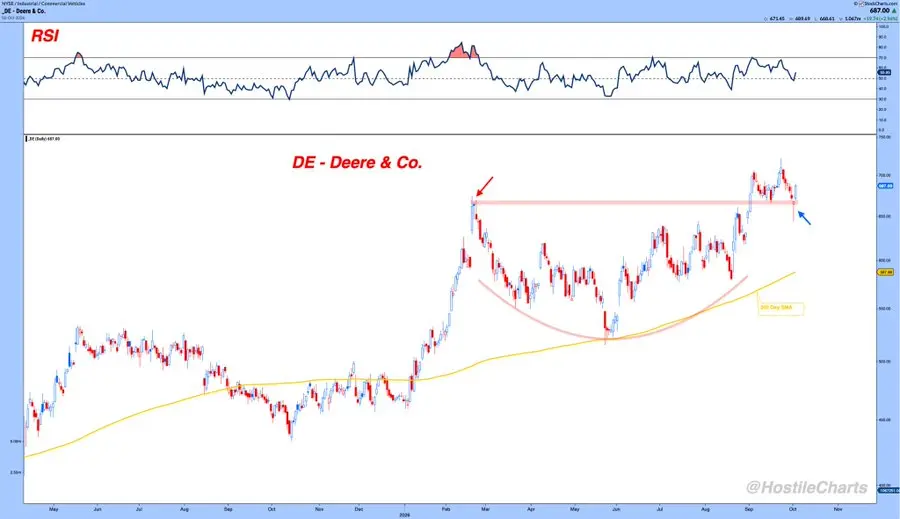
Deere & Co. Stock Hits Record High Above $700
Deere & Company is engaged in the delivery of agricultural, construction and forestry equipment. Its segments include production and precision agriculture (PPA), small agriculture and turf (SAT), construction and forestry (CF), and financial services (FS). PPA segment defines, develops and delivers global equipment and technology solutions for production-scale growers of large grains, small grains, cotton and sugarcane. SAT segment defines, develops and delivers global equipment and technology solutions for dairy and livestock producers, high-value and small acreage crop producers, and turf and utility customers. CF segment defines, develops and delivers a range of machines and technology solutions organized along the earthmoving, forestry and roadbuilding production systems. FS segment finances sales and leases by John Deere dealers of new and used production and precision agriculture equipment and others. Its products include John Deere Autonomous 8R Tractor and E-Power Backhoe. It operates in the Industrials sector (FARM MACHINERY & EQUIPMENT industry).
Deere & Co is currently priced at $646.15, with a forward P/E of 29.33, which indicates that the stock is relatively expensive compared to its earnings potential. The RSI is at 51.90, suggesting that the stock is neither overbought nor oversold, which supports a hold position. The main risk is the insider selling activity, which has increased by 384.66% over the last month, indicating potential concerns among insiders about the company's future performance.
22 analysts cover DE: 7 rate it Buy, 14 Hold and 1 Sell. The average price target is 514.25.

🚨 Global Markets Analysis — Market Watch Global markets are showing modest positive momentum, with FRA40 and DE40 trading higher while XAUJPY posts a small gain. The moves are relatively limited, so traders should watch for stronger price action and volume confirmation before expecting a larger trend. 📊 Markets to Watch 🟢 FRA40: +0.31% — Leading this group with the strongest gain. Continued buying pressure could support further upside if resistance breaks. 🟢 DE40: +0.14% — Showing modest positive momentum. Watch whether buyers can sustain the move and push above nearby resistance. 🟢 XAUJPY: +0.05% — Nearly flat, indicating limited movement in this snapshot. A stronger directional move is needed to confirm momentum. 🎯 Key Factors to Monitor 📈 Bullish Signal: Sustained gains and a confirmed breakout above local resistance. ⚠️ Reversal Risk: Small gains can quickly fade if buying pressure weakens. 📊 Confirmation Matters: Monitor price structure, trading activity, and relevant market catalysts before entering a trade. 🔥 My Take: FRA40 is the strongest performer in this group, followed by DE40, while XAUJPY remains nearly unchanged. Momentum is mildly positive, but confirmation is needed before anticipating a stronger move. Market commentary for educational purposes only. Not financial advice. $FRA40 $DE $XAUJPY
Show more
$DE is struggling at the $690 resistance level / zone. A close below $668 would be the put trigger and indicate a break of structure!
Show more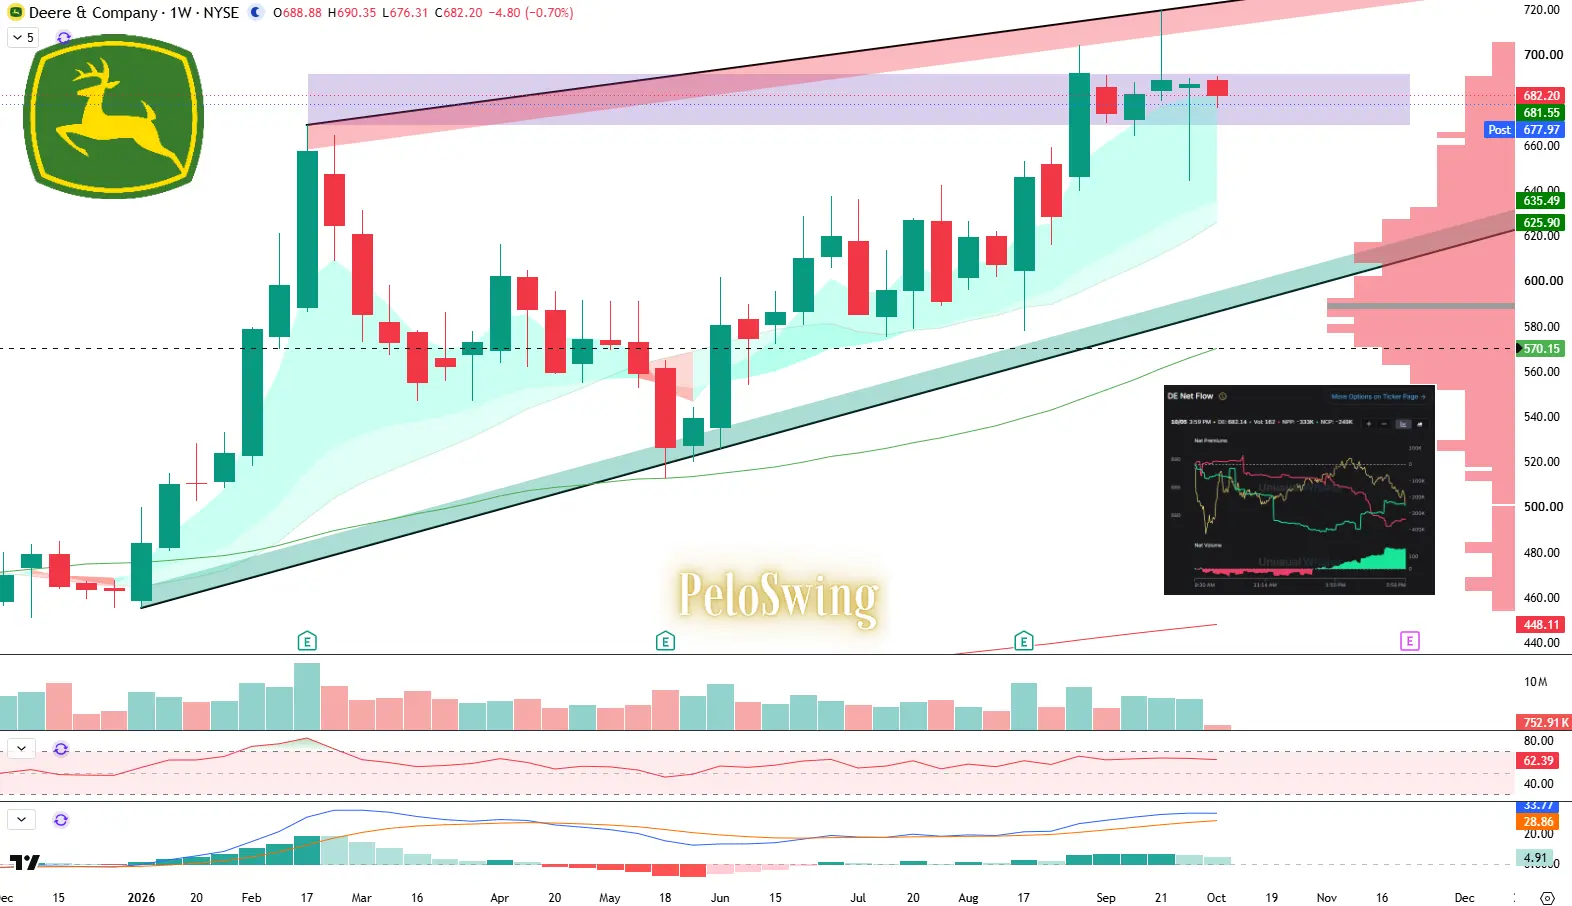

This page is for research only and is not investment advice. Models can be wrong. Past performance does not guarantee future results.