
B
Bull
Bull · 25%CDNS
$371.88
Scenario price
$329.460
-4.678 (-1.42%)At close
Cadence Design Systems, Inc. is an electronic systems designing company. The Company applies its Intelligent System Design strategy to deliver software, hardware and intellectual property (IP) that turn design concepts into reality. Its product categories include Core Electronic Design Automation (EDA), Semiconductor IP, and System Design and Analysis (SD&A). Core EDA includes software, hardware, and services used to design and verify a wide variety of semiconductors. The semiconductor IP portfolio includes silicon subsystems, software, and services that are used in semiconductor design. The SD&A category provides solutions and services that enable the design and verification of complete electronic systems, from PCBs to complex system assemblies. Its semiconductors are used in various industries, including automotive, aerospace, biotech, hyperscale and cloud computing, data centers, telecommunications, medical technology, industrial Internet of things, and artificial intelligence (AI).
Cadence Design Systems Inc is currently at a price of $352.84, which is close to the analyst price targets of $375 and $420, indicating potential upside. However, the RSI is at 69.283, suggesting that the stock is nearing overbought territory, which could lead to a pullback. Additionally, the stock has seen a 21.93% increase over the last 20 days, reflecting strong momentum, but recent insider selling raises some caution. Therefore, while the stock has positive growth indicators, it may be prudent to hold rather than buy at this moment due to the high RSI and potential for short-term volatility.
Deutsche Bank
$420
2026-10-07
Deutsche Bank
2026-10-07
Price Target
$420
FBN Securities
$375
2026-09-11
FBN Securities
2026-09-11
Price Target
$375
Oppenheimer
$300
2026-07-28
Oppenheimer
2026-07-28
Price Target
$300
Baird
$420
2026-07-28
Baird
2026-07-28
Price Target
$420
Piper Sandler
$349
2026-07-28
Piper Sandler
2026-07-28
Price Target
$349
Scenario prices are the last monthly forecast band of the current year. Probabilities are fixed model weights (25 / 50 / 25), not guarantees.

Cadence to Release Q3 2026 Financial Results on October 26

Honeywell Shares Surge 7.5%, Leading Nasdaq 100 Performers
Cadence Expands Partnership with TSMC for Advanced AI Solutions

Cadence CEO Sells Shares to Cover Tax Obligations

Cadence Executive Sells Shares to Meet Tax Obligations
Cadence Design Systems, Inc. is an electronic systems designing company. The Company applies its Intelligent System Design strategy to deliver software, hardware and intellectual property (IP) that turn design concepts into reality. Its product categories include Core Electronic Design Automation (EDA), Semiconductor IP, and System Design and Analysis (SD&A). Core EDA includes software, hardware, and services used to design and verify a wide variety of semiconductors. The semiconductor IP portfolio includes silicon subsystems, software, and services that are used in semiconductor design. The SD&A category provides solutions and services that enable the design and verification of complete electronic systems, from PCBs to complex system assemblies. Its semiconductors are used in various industries, including automotive, aerospace, biotech, hyperscale and cloud computing, data centers, telecommunications, medical technology, industrial Internet of things, and artificial intelligence (AI). It operates in the Technology sector (SERVICES-PREPACKAGED SOFTWARE industry).
Cadence Design Systems Inc is currently at a price of $352.84, which is close to the analyst price targets of $375 and $420, indicating potential upside. However, the RSI is at 69.283, suggesting that the stock is nearing overbought territory, which could lead to a pullback. Additionally, the stock has seen a 21.93% increase over the last 20 days, reflecting strong momentum, but recent insider selling raises some caution. Therefore, while the stock has positive growth indicators, it may be prudent to hold rather than buy at this moment due to the high RSI and potential for short-term volatility.
9 analysts cover CDNS: 3 rate it Buy, 5 Hold and 1 Sell. The average price target is 350.00.

$CDNS Earlier this month, I highlighted a severe fundamental dislocation in the equity. Shares were down ~30% from all-time highs despite compounding revenue, net income, and free cash flow trajectories reaching new record baselines. Since issuing that accumulation alert, CDNS has staged a powerful reversal, rallying over 20% off its lows. As the equity approaches a key cluster of overhead resistance levels, now is an opportune time to review the charts and valuation roadmap. Long $CDNS.
Show more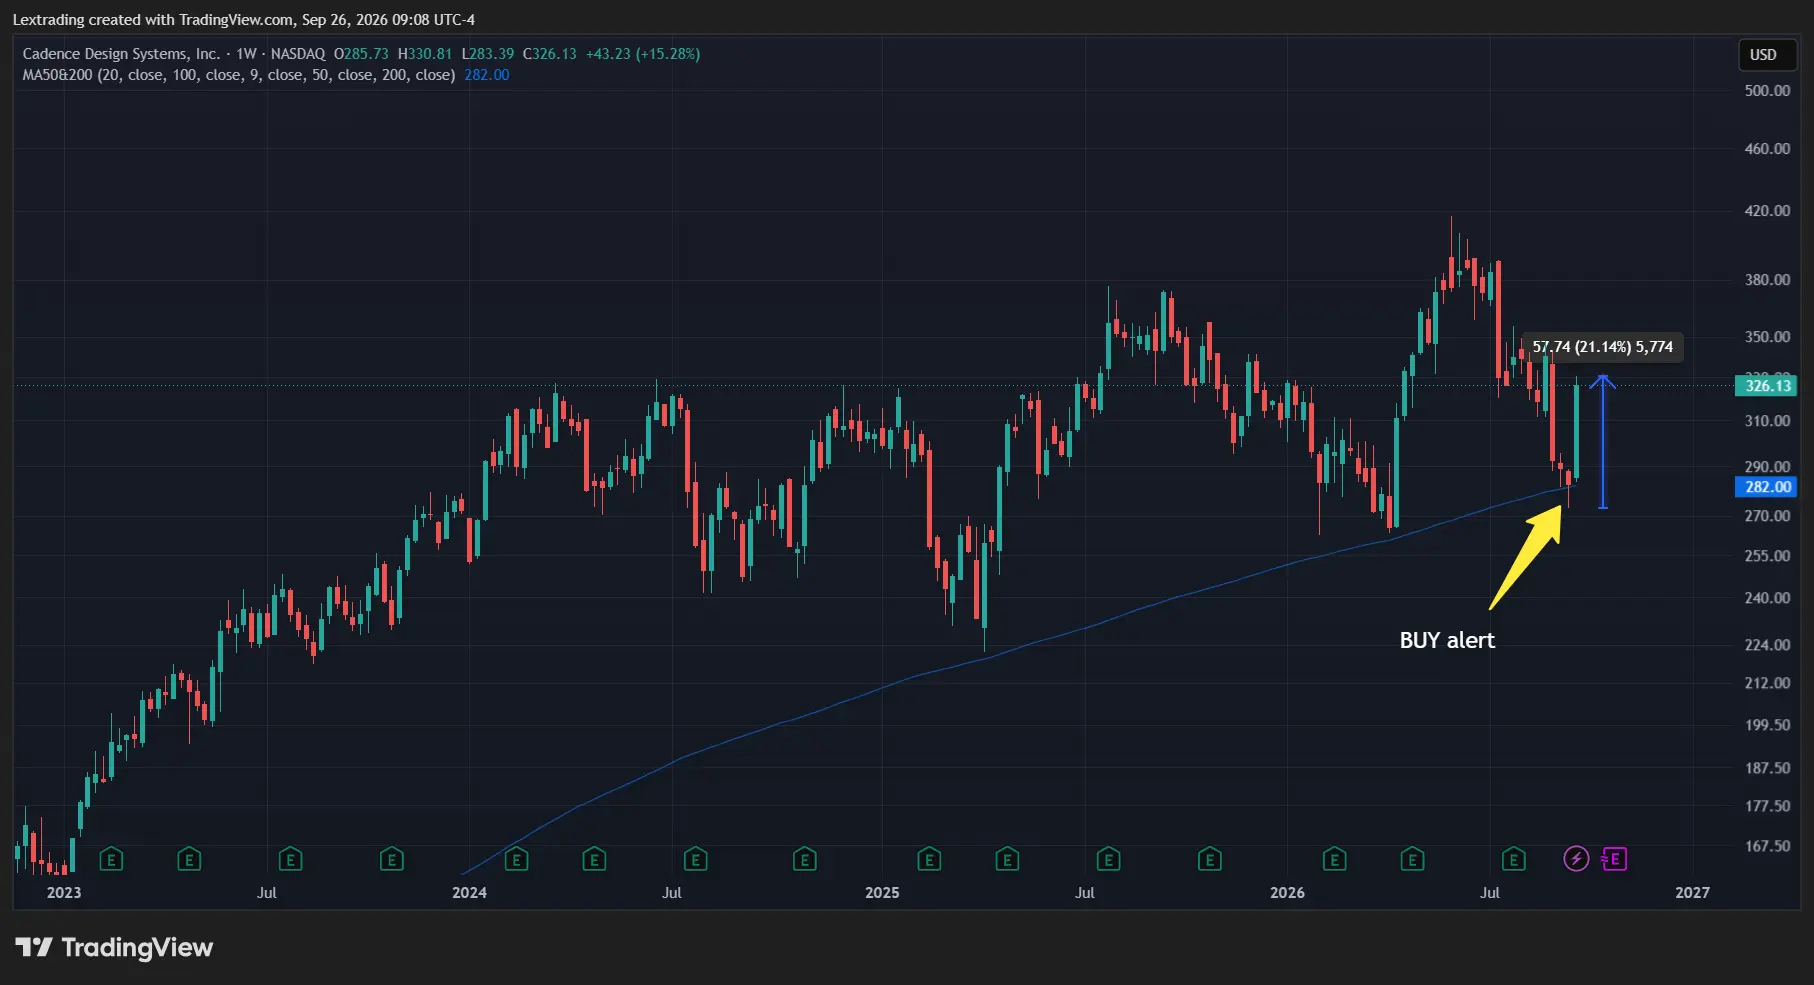
$CDNS $NOW When a high-quality stock pulls back into major technical support, the market is basically handing you a gift: rich premiums with structurally low probability of assignment. Why? Because strong fundamentals plus strong technicals create a natural floor. Wide-moat companies don't usually slice cleanly through well-defined support — buyers step in, long-term funds rebalance, and algorithms defend those levels. That stability makes out-of-the-money put selling one of the most asymmetric trades in the entire options market. You're getting paid precisely when fear is elevated, volatility is inflated, and the odds of a deeper breakdown are historically low. If the stock holds support (as high-quality names tend to do), your puts decay, your premium becomes profit, and you walk away with income for simply being willing to buy a great business at a discount. One contract on setups like the ones I traded this week — NOW and CDNS — pays for more than a full year of my research service. One disciplined trade at a key level covers twelve months of research, charts, and real-time breakdowns. That's the beauty of selling premium on elite companies at structural demand zones: You're not chasing risk — you're monetizing other people's panic.
Show more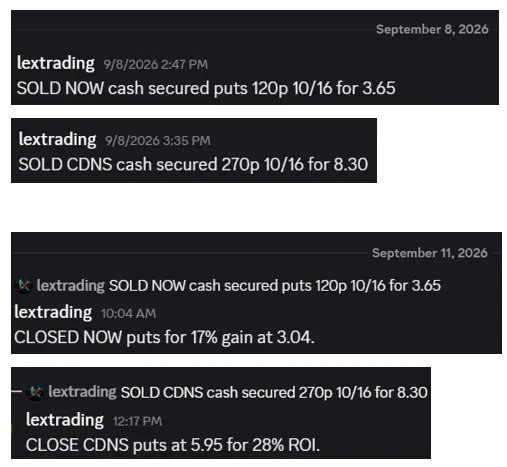
This page is for research only and is not investment advice. Models can be wrong. Past performance does not guarantee future results.