
B
Bull
Bull · 25%ARHS
$9.90
Scenario price
$10.940
+0.214 (+1.96%)At close
Arhaus, Inc. is a home furnishings brand. The Company operates a vertically integrated model, designing and sourcing products directly from skilled artisans and selected manufacturing vendors around the world, including domestic upholstery production at its own North Carolina manufacturing facility. It has approximately 100 showrooms and design center locations across the United States. Its product assortments span a range of categories and styles, including bedroom, dining room, living room, home office furnishings, and include sofas, dining tables and chairs, accent chairs, console and coffee tables, beds, headboards, dressers, desks, bookcases, modular storage, among others. Its outdoor product assortment includes outdoor dining tables, chairs, chaises and other furniture, lighting, textiles, decor, umbrellas and fire pits. Its bath product assortment includes vanities and storage pieces, faucets and hardware, and Turkish bath towels.
Arhaus Inc is a good buy right now due to its recent upgrade by Jefferies, which sees a price target of $10, representing a 28% upside from the current price of $9.93. Additionally, the company's gross margin has improved significantly to 44.71% in Q2 2026, indicating strong profitability. The main risk is the year-to-date change of -12.59%, reflecting potential market volatility.
Scenario prices are the last monthly forecast band of the current year. Probabilities are fixed model weights (25 / 50 / 25), not guarantees.

Latest Wall Street Ratings Overview

HP Shares Drop Over 3% Amid Uncertain Fiscal Outlook

Paramount and California AG Reach Settlement, Shares Surge
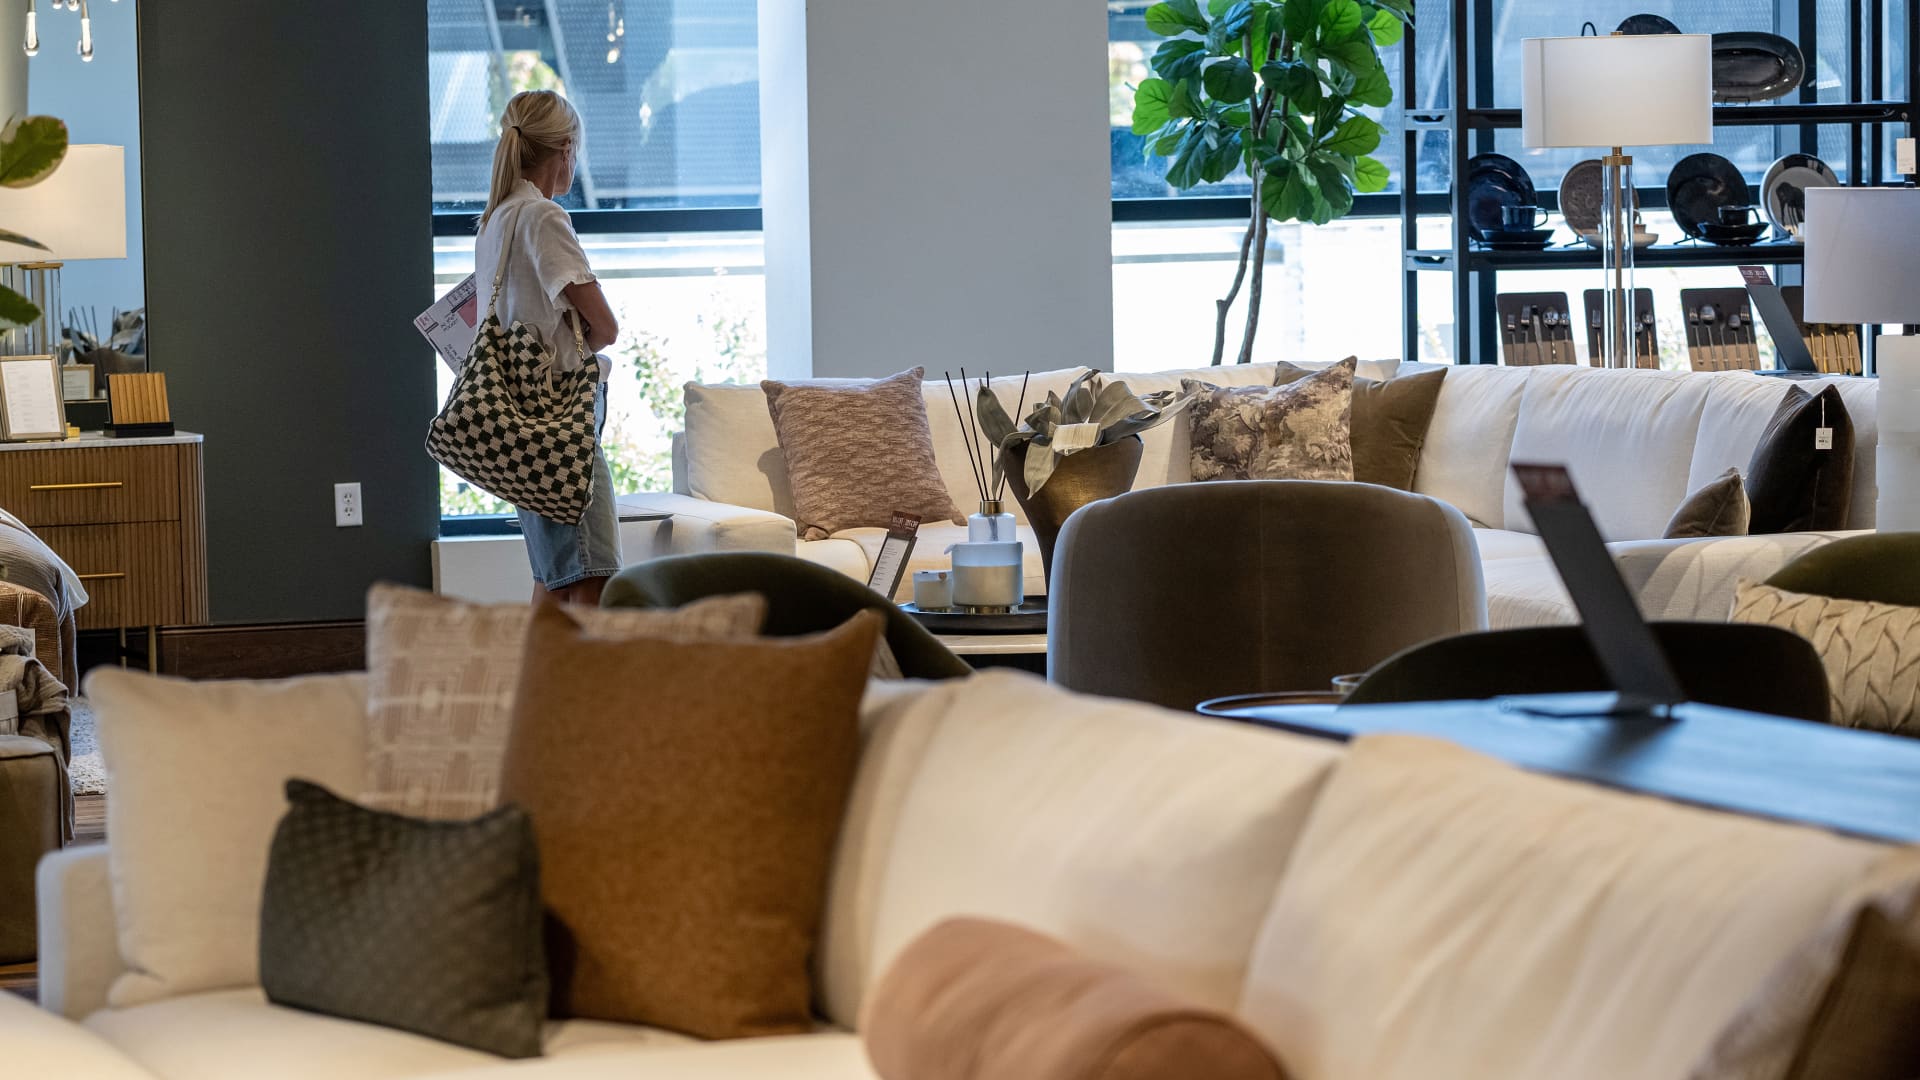
Jefferies Upgrades Arhaus to Buy, Sees 28% Upside

Williams-Sonoma Stock Rises 23% Despite Housing Market Weakness
Arhaus, Inc. is a home furnishings brand. The Company operates a vertically integrated model, designing and sourcing products directly from skilled artisans and selected manufacturing vendors around the world, including domestic upholstery production at its own North Carolina manufacturing facility. It has approximately 100 showrooms and design center locations across the United States. Its product assortments span a range of categories and styles, including bedroom, dining room, living room, home office furnishings, and include sofas, dining tables and chairs, accent chairs, console and coffee tables, beds, headboards, dressers, desks, bookcases, modular storage, among others. Its outdoor product assortment includes outdoor dining tables, chairs, chaises and other furniture, lighting, textiles, decor, umbrellas and fire pits. Its bath product assortment includes vanities and storage pieces, faucets and hardware, and Turkish bath towels. It operates in the Consumer Cyclicals sector (RETAIL-FURNITURE STORES industry).
Arhaus Inc is a good buy right now due to its recent upgrade by Jefferies, which sees a price target of $10, representing a 28% upside from the current price of $9.93. Additionally, the company's gross margin has improved significantly to 44.71% in Q2 2026, indicating strong profitability. The main risk is the year-to-date change of -12.59%, reflecting potential market volatility.
No posts yet
Sign up or log in to join the discussionThis page is for research only and is not investment advice. Models can be wrong. Past performance does not guarantee future results.