
B
Bull
Bull · 25%ANNA
$4.96
Scenario price
$2.510
+0.148 (+5.91%)At close
AleAnna, Inc. is a natural gas resource company. It is focused on delivering critical natural gas supplies to Europe through both onshore conventional natural gas exploration and renewable natural gas development in Italy. The Company operates through two segments: the Conventional segment and the Renewable segment. The Conventional segment consists of the natural gas exploration and production activities conducted by AleAnna Italia. The primary product of this segment is conventional natural gas produced from onshore exploration and development in Italy. The Renewable segment consists of the renewable natural gas (RNG) and electricity production activities conducted by AleAnna Renewable and the RNG subsidiaries. The primary output of this segment is electricity generated from RNG derived from animal and agricultural waste. The Company has conventional natural gas discoveries, including its primary discovery, the Longanesi Field, located in the Po Valley in Northern Italy.
Aleanna, Inc. Class A Common Stock (ANNA) is currently not a good buy due to its low RSI of 35.461, indicating it is oversold, and a significant decline of 39.02% over the past year. Although there are signs of improving net income, with Q1 2026 showing $3.4 million, the stock's recent performance and technical indicators suggest caution. The main risk is its current price of $2.55, which is below the 200-day simple moving average of $3.375, indicating a bearish trend.
Scenario prices are the last monthly forecast band of the current year. Probabilities are fixed model weights (25 / 50 / 25), not guarantees.

AleAnna Reports Q1 2026 Financial Results

Morgan Stanley Keeps Oil Price Forecast Steady at $110 for Q2 2026
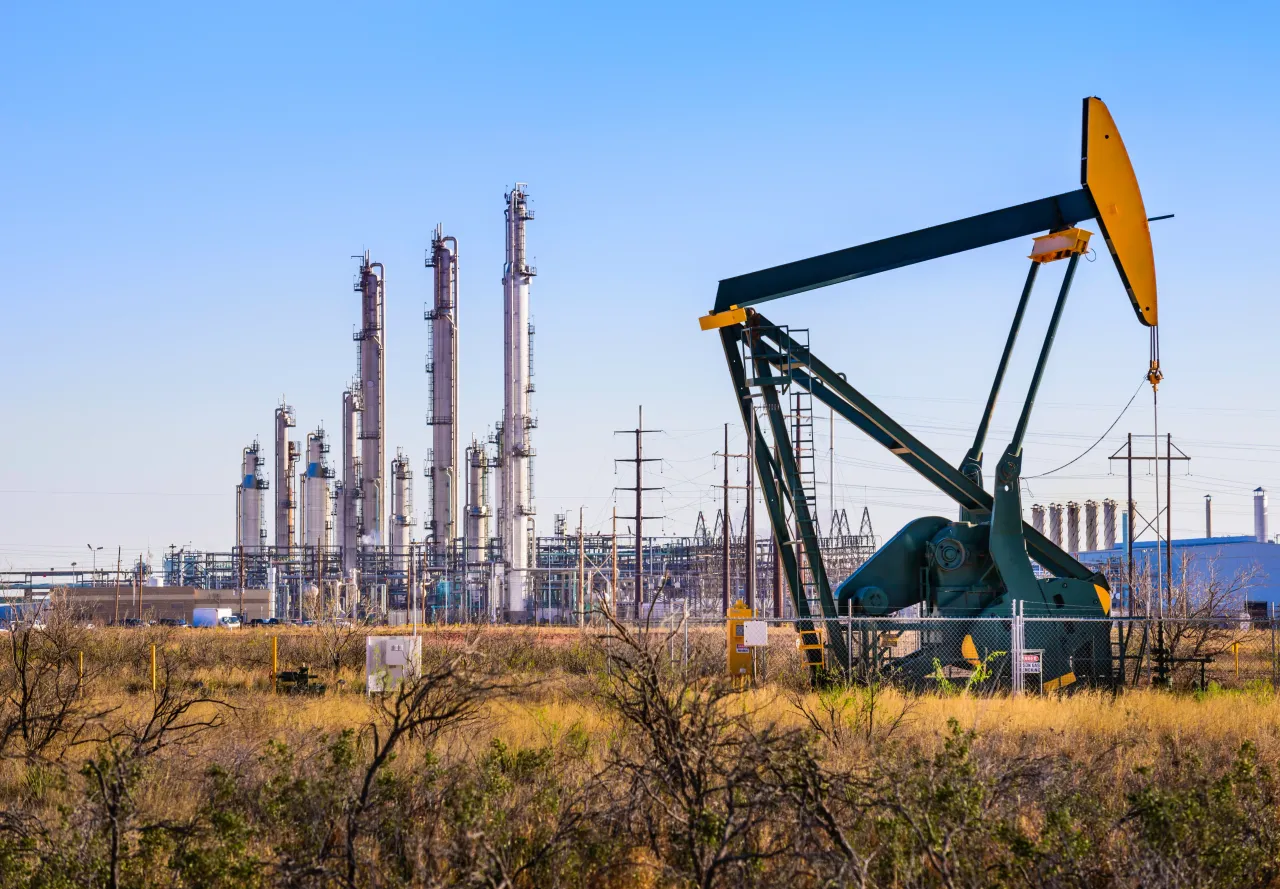
Sky Quarry Reports Record 146% Weekly Surge Amid U.S.-Iran Tensions

Trump's Comments Fail to Alleviate Market Concerns
AleAnna Reports Q4 Revenue Surge of 1087%
AleAnna, Inc. is a natural gas resource company. It is focused on delivering critical natural gas supplies to Europe through both onshore conventional natural gas exploration and renewable natural gas development in Italy. The Company operates through two segments: the Conventional segment and the Renewable segment. The Conventional segment consists of the natural gas exploration and production activities conducted by AleAnna Italia. The primary product of this segment is conventional natural gas produced from onshore exploration and development in Italy. The Renewable segment consists of the renewable natural gas (RNG) and electricity production activities conducted by AleAnna Renewable and the RNG subsidiaries. The primary output of this segment is electricity generated from RNG derived from animal and agricultural waste. The Company has conventional natural gas discoveries, including its primary discovery, the Longanesi Field, located in the Po Valley in Northern Italy. It operates in the Energy sector.
Aleanna, Inc. Class A Common Stock (ANNA) is currently not a good buy due to its low RSI of 35.461, indicating it is oversold, and a significant decline of 39.02% over the past year. Although there are signs of improving net income, with Q1 2026 showing $3.4 million, the stock's recent performance and technical indicators suggest caution. The main risk is its current price of $2.55, which is below the 200-day simple moving average of $3.375, indicating a bearish trend.
No posts yet
Sign up or log in to join the discussionThis page is for research only and is not investment advice. Models can be wrong. Past performance does not guarantee future results.