B
Bull
Bull · 25%AMP
$712.23
Scenario price
$500.800
-1.753 (-0.35%)At close
Ameriprise Financial, Inc. is a diversified financial services company. The Company’s segments include Advice & Wealth Management, Asset Management, Retirement & Protection Solutions and Corporate & Other. The Advice & Wealth Management segment provides financial planning and advice, as well as full-service brokerage services, primarily to retail clients through the Company’s advisors. The Asset Management segment provides investment management, advice and products to retail, high net worth and institutional clients on a global scale through the Columbia Threadneedle Investments brand. It provides institutional products and services through its institutional sales force. The Retirement & Protection Solutions segment includes retirement solutions (variable annuities and payout annuities) and protection solutions (life and disability income insurance). Retirement Solutions provides variable annuity products by RiverSource Life companies to individual clients.
Currently, Ameriprise Financial Inc is trading at $500.51, which is close to the average analyst price target of $570, indicating limited upside potential. The forward P/E ratio is attractive at 9.76, suggesting the stock is undervalued compared to its earnings potential. However, the RSI is at 50.68, indicating a neutral momentum, and the stock has seen a 20-day change of -10.24%, which raises concerns about short-term performance. Given these factors, it may be prudent to hold rather than buy at this moment.
Morgan Stanley
$483
2026-10-09
Morgan Stanley
2026-10-09
Price Target
$483
Evercore ISI
$632
2026-10-07
Evercore ISI
2026-10-07
Price Target
$632
BMO Capital
$520
2026-10-06
BMO Capital
2026-10-06
Price Target
$520
BofA
$570
2026-10-05
BofA
2026-10-05
Price Target
$570
Raymond James
$638
2026-08-21
Raymond James
2026-08-21
Price Target
$638
Scenario prices are the last monthly forecast band of the current year. Probabilities are fixed model weights (25 / 50 / 25), not guarantees.

Three Financial Advisor Teams Join Ameriprise Financial
Ameriprise Financial Named One of America's Best Companies for 2026

Ameriprise Financial Named One of America's Greatest Workplaces for 2026
Ameriprise Financial Authorizes $5.5 Billion Share Buyback Program

Ameriprise Financial to Release Q3 2026 Earnings Results
Ameriprise Financial, Inc. is a diversified financial services company. The Company’s segments include Advice & Wealth Management, Asset Management, Retirement & Protection Solutions and Corporate & Other. The Advice & Wealth Management segment provides financial planning and advice, as well as full-service brokerage services, primarily to retail clients through the Company’s advisors. The Asset Management segment provides investment management, advice and products to retail, high net worth and institutional clients on a global scale through the Columbia Threadneedle Investments brand. It provides institutional products and services through its institutional sales force. The Retirement & Protection Solutions segment includes retirement solutions (variable annuities and payout annuities) and protection solutions (life and disability income insurance). Retirement Solutions provides variable annuity products by RiverSource Life companies to individual clients. It operates in the Financials sector (INVESTMENT ADVICE industry).
Currently, Ameriprise Financial Inc is trading at $500.51, which is close to the average analyst price target of $570, indicating limited upside potential. The forward P/E ratio is attractive at 9.76, suggesting the stock is undervalued compared to its earnings potential. However, the RSI is at 50.68, indicating a neutral momentum, and the stock has seen a 20-day change of -10.24%, which raises concerns about short-term performance. Given these factors, it may be prudent to hold rather than buy at this moment.
11 analysts cover AMP: 6 rate it Buy, 5 Hold and 0 Sell. The average price target is 559.71.

$AMP is at 0.000806. The nearest resistance above, the Bollinger upper band at 0.000773, has already been broken. The level really worth watching is the psychological zone around 0.00085. On the downside, the first support is MA5 at 0.000745, and the second support is MA20 at 0.000690. First, the method: to judge whether a rally is healthy, look at only two things — moving average alignment and where RSI sits. When MA5 is above MA20 and both are rising together, it means short- and medium-term costs are both moving up, and the trend structure is intact. But RSI at 81.7 has entered overbought territory, meaning the risk-reward of chasing higher is getting worse. The right move here is not to guess the top, but to wait for a pullback confirmation: if price falls back near MA5 and stabilizes, and the MACD histogram is still positive, that is a second entry point; if it breaks directly below MA20, the trend weakens and the bullish case is invalidated. $AMP currently has MA5 = 0.0007452 above MA20 = 0.0006895, the MACD histogram at +1.412e-05 remains bullish, 24h gain is 21.57%, and the 30-candle range is 26.18%, a typical high-volatility breakout pattern. The Fear & Greed Index at 63 is in greed territory — sentiment is warm but not extreme — and with the Bollinger upper band broken, there may still be short-term momentum. In terms of action, a pullback long is preferred over chasing highs. Entry reference: 0.000740–0.000760 (near MA5); take-profit 1 at 0.000850 (prior high extension), take-profit 2 at 0.000920 (measured move by equal range); stop-loss at 0.000680 (below MA20; a break below means the structure is broken). Also watch: $DOG and $ZK. Both are below MA5 with bearish MACD, clearly weaker than $AMP, suggesting funds are more concentrated in the stronger names. (Personal view only, for reference, not investment advice. Futures risk is extremely high, please strictly control position size.) [Data] Pair: AMPUSDT Direction: Long Entry: 0.000740-0.000760 Take-profit 1: 0.000850 Take-profit 2: 0.000920 Stop-loss: 0.000680
Show more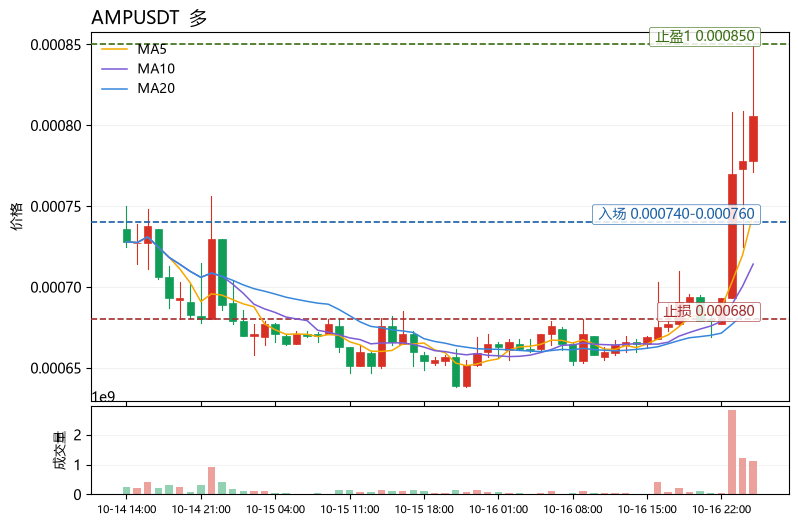

$AMP-USD · 1D This cup and handle pattern is progressing well so far. Please excuse the somewhat uneven curves, but you get the idea :) Amp is ready to move.
Show more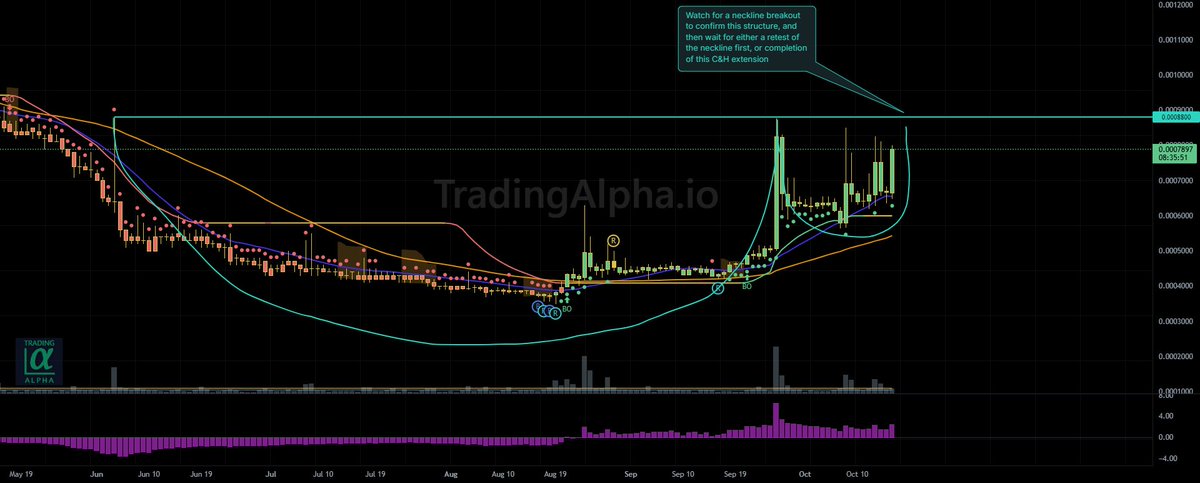


$XRP is currently at 1.3698. The bias is slightly long, but I will only buy dips within the range and not chase highs. Reasons: MA5=1.36984 is slightly above MA20=1.36891, the moving averages are compressed, and the MACD histogram at +0.001538 remains bullish, but RSI is only 49.6, so momentum is neutral; Bollinger Bands have narrowed to 1.35786-1.37996, and the 30-candle range is only 5.23%, indicating a low-volatility compression state. The real risk point is: the funding rate is -0.0056%, shorts are paying, which shows longs are not crowded, but the greed index at 57 means market sentiment is somewhat hot. Once price breaks below the lower Bollinger Band on volume, the downside expansion after compression could be very damaging. Position sizing suggestion: no more than 5% of total capital, leverage within 3x. Entry reference 1.362-1.370 (near MA20 and the middle Bollinger Band); take-profit 1 at 1.380 (upper Bollinger Band, resistance level); take-profit 2 at 1.395 (measured target after breaking above the upper band); stop-loss at 1.354 (after breaking below the lower Bollinger Band at 1.35786 and confirming, viewed as a range breakdown). Exit signal: if the 4-hour close loses 1.354 and the MACD histogram turns negative, exit regardless of profit or loss; if price spikes to 1.380 but RSI does not exceed 60, treat it as a false breakout and actively cut the position by half. Worst-case scenario: after low-volatility compression, price chooses a downward direction, and combined with fading greedy sentiment, it may quickly retrace to the 1.34 area. At that point, stop-loss discipline is the only defense; do not hold a losing position hoping for a rebound. Also watch: $AMP and $ZK have risen 13.25% and 11.84% respectively, with relative strength clearly stronger than $XRP, but their ranges are as high as 28.69% and 21.34%, so volatility risk is far higher than major coins. They are only for observation, not for heavy positions. (Personal view, for reference only, not any investment advice. Contract risk is extremely high, please strictly control position size.) [Data] Symbol: XRPUSDT Direction: Long Entry: 1.362-1.370 Take-profit 1: 1.380 Take-profit 2: 1.395 Stop-loss: 1.354
Show more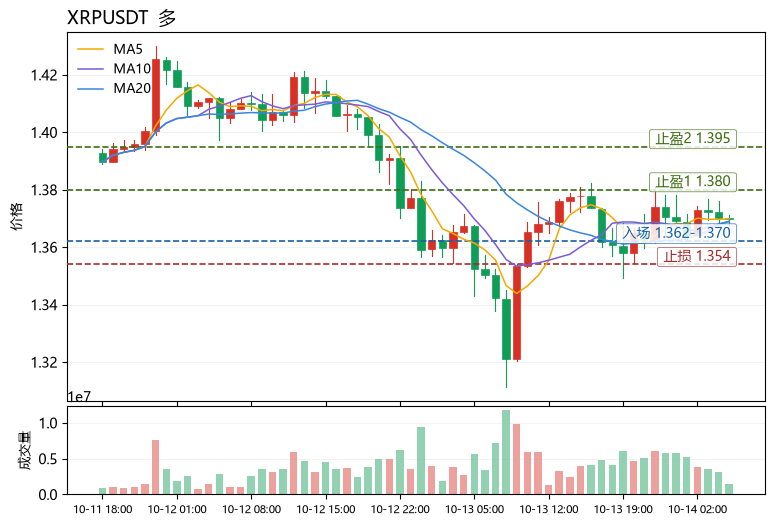
$AMP The most unusual thing today: it pumped +22.68% in 24h, but funding rates didn't show the kind of heat you'd expect from longs, which suggests this move was driven more by short covering than by new longs actively adding positions. Price is now at 0.000714, holding above MA5 (0.0007088) and MA20 (0.00065895), MACD histogram at +3.641e-06 remains bullish, RSI at 57.8 is not yet overbought, and the upper Bollinger Band at 0.000793048 is the first resistance for this leg; the 30-candle range is about 42.44%, so wick risk is not low and chasing highs can easily get you stopped out. The Fear & Greed Index at 59 is still in greed territory, so sentiment offers support but limited room. Bias is long, but don't chase. Entry reference 0.000690–0.000705 (pullback near MA5, just above the middle Bollinger Band); take-profit 1 at 0.000760 (first resistance before the upper Bollinger Band, reduce position as RSI approaches 65); take-profit 2 at 0.000793 (upper Bollinger Band, exit first if MACD histogram shrinks); stop-loss at 0.000655 (break below MA20 with MACD weakening, bullish structure broken). Also watching: $CR, $SKL. The former is in bearish alignment and relatively weak; the latter is rising but its funding rate of -0.2907% shows crowded shorts, and its relative strength is weaker than $AMP. (Personal view only, for reference only, not any investment advice. Futures risk is extremely high, please strictly control position size.) [Data] Pair: AMPUSDT Direction: Long Entry: 0.000690-0.000705 Take-profit 1: 0.000760 Take-profit 2: 0.000793 Stop-loss: 0.000655
Show more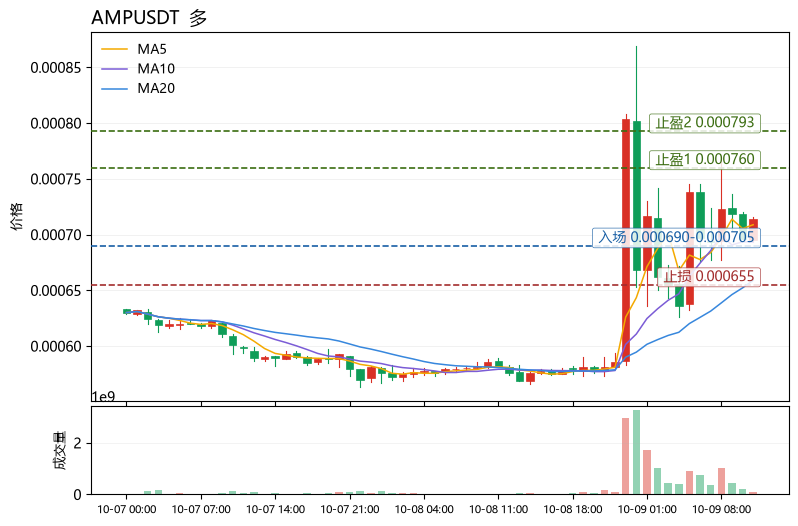
This page is for research only and is not investment advice. Models can be wrong. Past performance does not guarantee future results.