

Visa FY2026 Q4 Deep Dive: Beat on Spend, Sold on Incentives & FY27 Guide
Sell-side deep dive into Visa Q4/FY2026: resilient consumer spend beat, client incentives +21%, FY27 low-double-digit guide, capital return, and the long vs short debate.


Visa FY2026 Q4 Deep Dive: Beat on Resilient Spend, Sold on Incentives and FY27 Guide — The Renewal Wave Is the Real Story
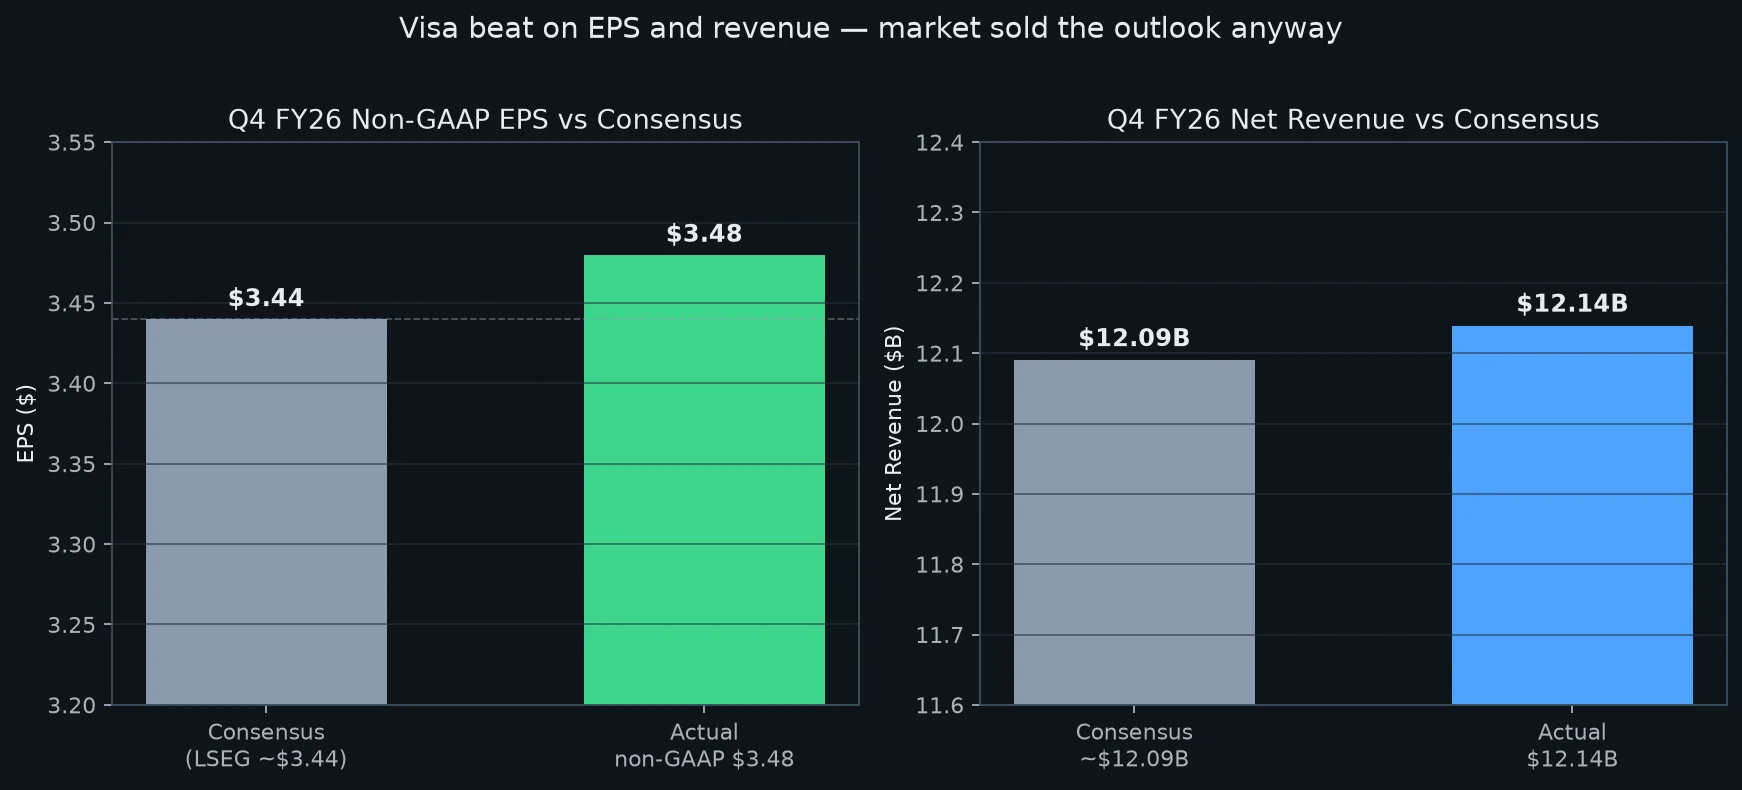
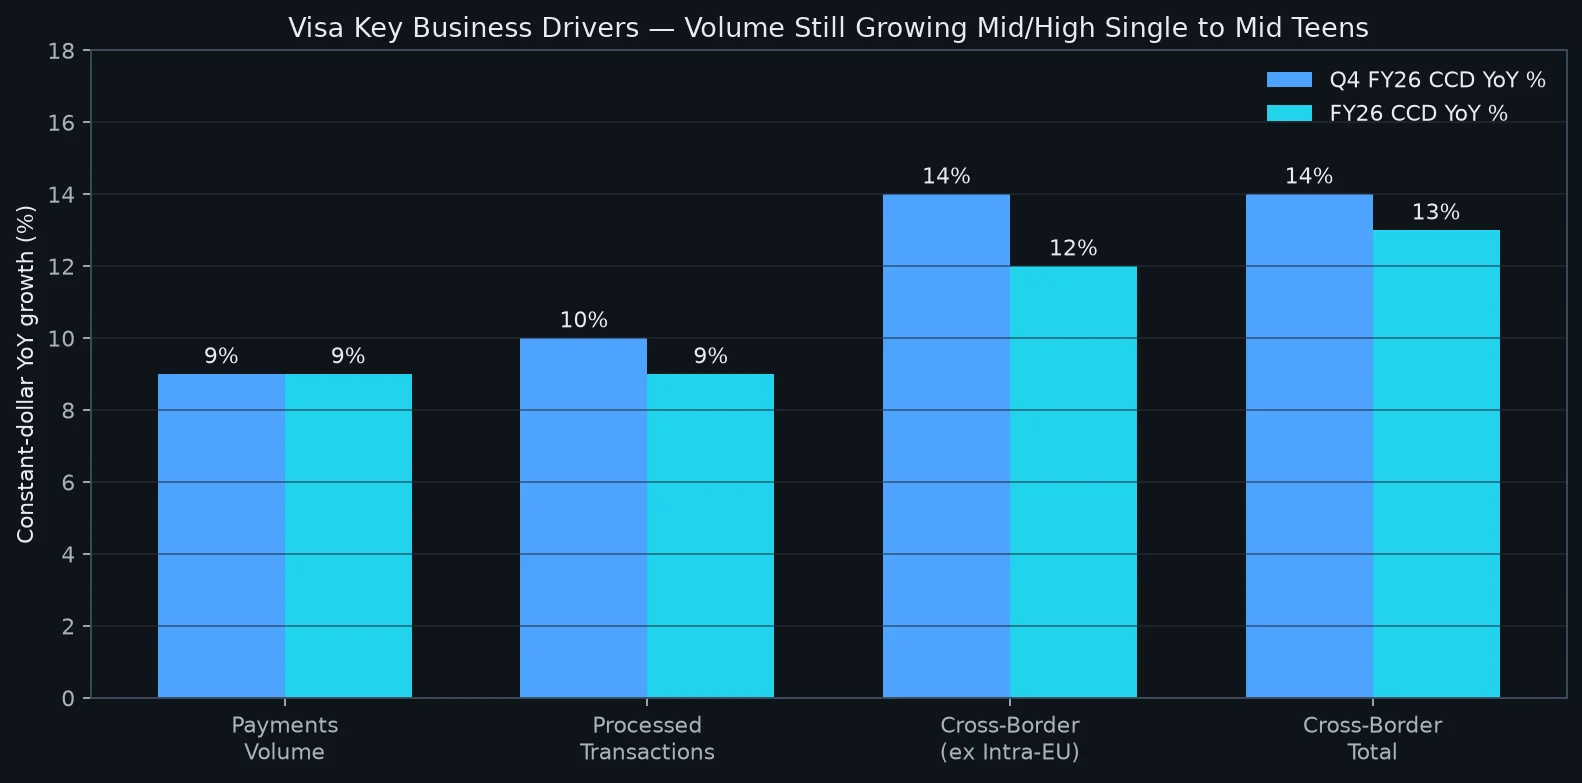
After the close on October 27, 2026 (US Eastern), Visa (NYSE: V) handed the market a print that looked like classic mega-cap quality — non-GAAP EPS $3.48 versus LSEG consensus near $3.44, net revenue $12.139B (+13% nominal and constant-dollar) versus Street revenue expectations clustered around $12.09B, payments volume still humming at +9% constant-dollar, cross-border excluding Intra-Europe +14%, processed transactions +10% to 74.2 billion in the quarter. Full-year net revenue hit a record $45.9B (+15%, or +14% constant-dollar), which CEO Ryan McInerney framed as the strongest growth in more than fifteen years excluding the post-pandemic rebound and acquisitions.
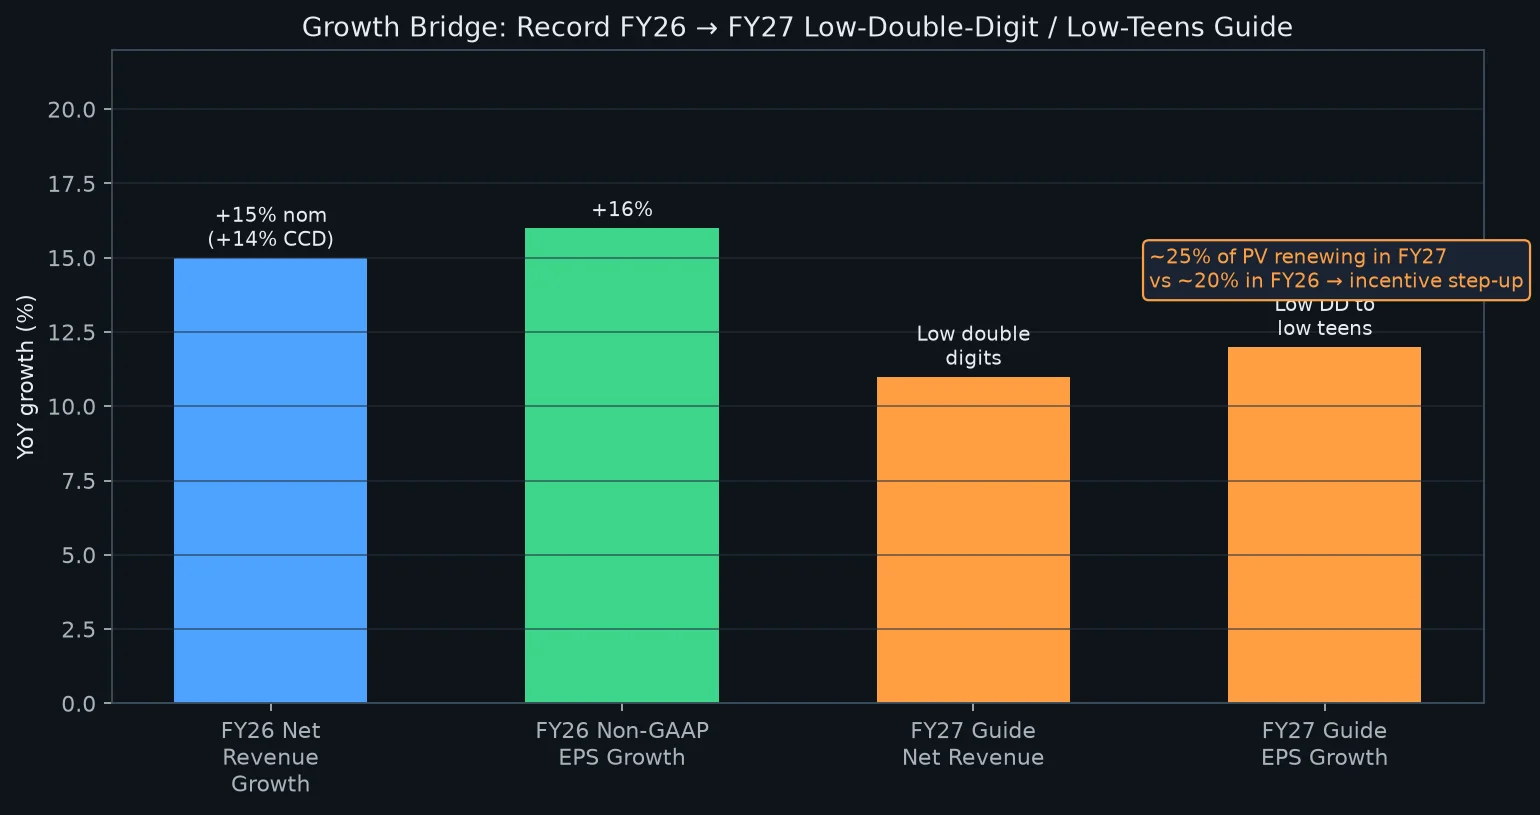
And then the tape did what it often does when a fortress compounder meets a renewal-year outlook: it sold the stock. Regular session closed at $401.86 (−0.57%). After hours, Reuters clocked roughly −1.4%; CNBC’s after-hours movers list had Visa down about 2%; Investing.com put extended trading near $396 (−1.46% from the close). The fear was not that consumers stopped swiping. The fear was that Visa has to pay more to keep them — client incentives jumped +21% to $5.123B in the quarter — and that fiscal 2027’s guide (adjusted net revenue growth in the low double digits, adjusted EPS growth low double digits to low teens) looks like a deliberate step down from FY26’s +15% / +16% sprint, just as ~25% of payments volume comes up for renewal versus ~20% in FY26.
This is not a “broken franchise” print. It is a price-of-durability print. The rest of this note is about reading that price correctly — what beat, what the call sold, what the Street is nitpicking, and what would falsify either the bull or the bear.
1. What the market is afraid of (and what it is still celebrating)
Strip the headline beat and three anxieties show up in the after-hours chat and in the first wave of analyst notes:
- Incentive intensity is stepping up into a heavier renewal year. Q4 client incentives $5.123B, +21% YoY — a nearly three-point acceleration from Q3’s pace, driven by new deals signed in Q3 and early Q4. CFO Chris Suh told analysts FY27 will renew roughly 25% of payments volume, including several large clients, versus ~20% in FY26. That is not a mystery; it is a known contractual calendar colliding with a Street that models Visa as if incentives grow in a straight line.
- FY27 guide lands below the emotional high of FY26. Adjusted net revenue growth low double digits; adjusted operating expense also low double digits (modestly below revenue); EPS growth low double digits to low teens. After a year that printed +15% net revenue and +16% non-GAAP EPS, “low double digits” feels like deceleration even when it is still excellent absolute growth at Visa’s scale.
- EPS quality of the beat was partly tax. Suh said Q4 EPS was better than expected primarily due to a lower-than-expected tax rate (non-GAAP ETR 18.4%) from claim-of-right benefits tied to recent legal settlements — benefits that do not repeat into the FY27 tax assumption of ~19%.
What the market is still celebrating, even while selling:
- Consumer resilience across spend bands. Suh: growth across bands “remained relatively consistent with prior quarters, with the highest spend band continuing to grow the fastest,” and “we did not see signs of the lower-spend consumer weakening in our volumes.” That sentence is the macro insurance policy for the entire payments complex — and for Mastercard’s print later this week.
- Cross-border re-acceleration. Total cross-border excluding Intra-Europe +14% CCD in Q4, more than two points above Q3, with travel +13% (CEMEA inbound/outbound improving; FIFA host-city card-present inbound >+20% YoY mid-July) and cross-border e-commerce +17% (retail including AI-platform spend).
- Second engines still compounding. Full-year CMS +19% and VAS +30% constant-dollar; Q4 VAS +31% CCD to about $4B. McInerney said CMS + VAS already represent more than 40% of total net revenue — the structural argument that Visa is no longer “just interchange math.”
The emotional pattern rhymes with other mega-cap prints this earnings season: numbers clear the bar; the multiple clears its throat. Visa’s scare is quieter than a CapEx infinity story and more contractual: how much of tomorrow’s growth is being prepaid in today’s incentives.
2. The print: hard numbers, soft traps
Primary source for what follows is Visa’s October 27, 2026 fiscal fourth quarter and full-year earnings release (SEC furnished exhibit) and the fiscal Q4/FY2026 earnings call. Consensus anchors are LSEG via Reuters/Investing.com (EPS $3.44), Alphastreet / MarketBeat (revenue ~$12.09B, EPS $3.44).
| Metric | Q4 FY26 | Benchmark / prior | Delta / read-through |
|---|---|---|---|
| Net revenue | $12.139B | Street ~$12.09B; PY $10.724B | Beat; +13% YoY (nom & CCD) |
| GAAP NI / EPS | $6.002B / $3.19 | PY $5.090B / $2.62 | +18% / +22% |
| Non-GAAP NI / EPS | $6.552B / $3.48 | LSEG ~$3.44; PY non-GAAP $2.98 | Beat ~$0.04; +13% / +17% |
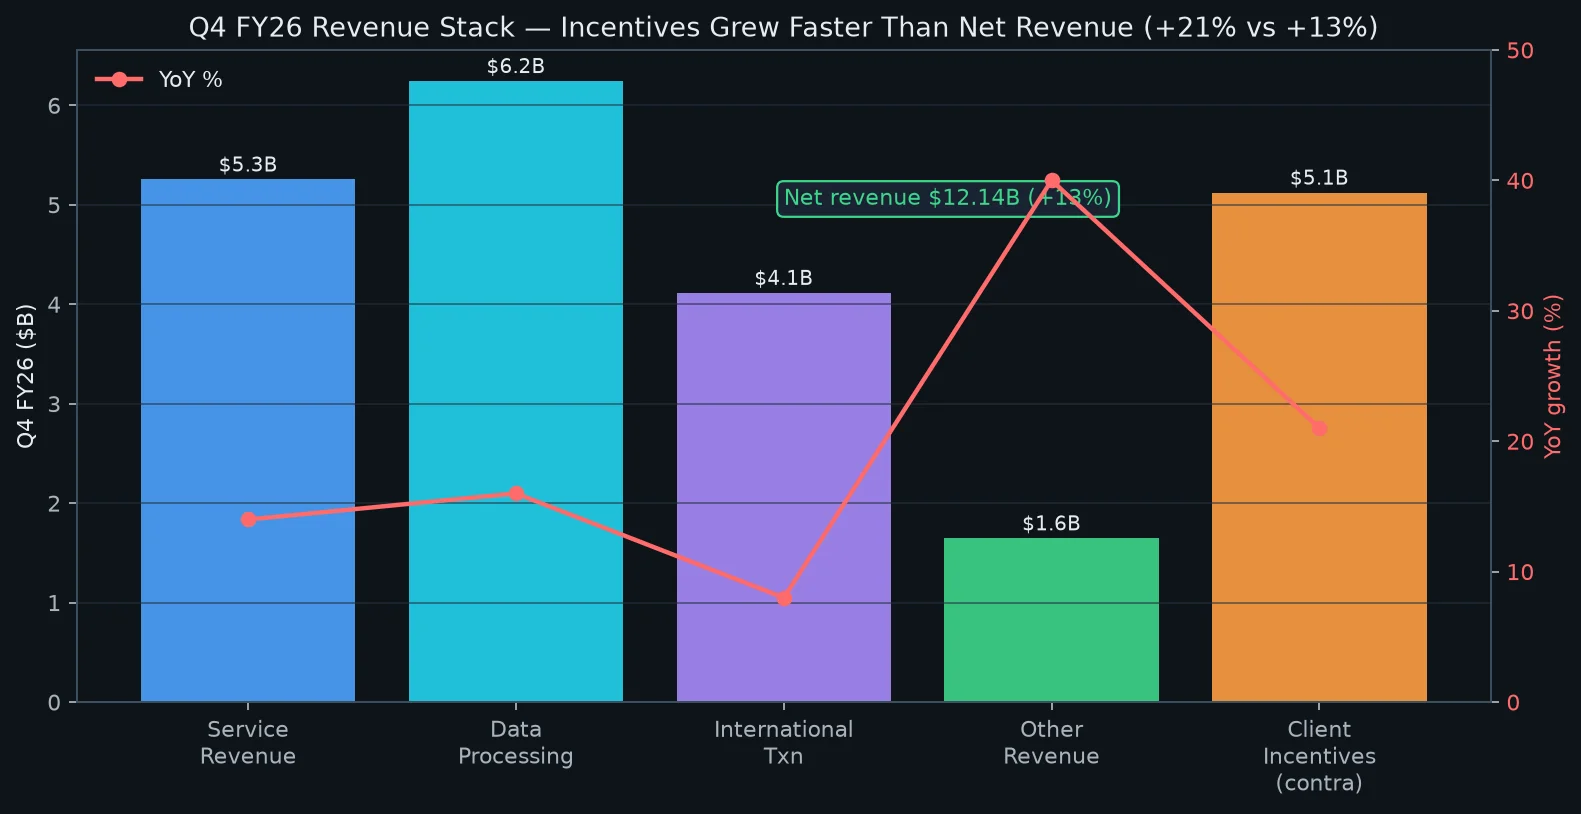
| Service revenue | $5.255B | — | +14% (on prior-qtr PV +10% CCD) |
| Data processing | $6.245B | — | +16% (txns +10% + pricing/mix/VAS) |
| International txn rev | $4.115B | — | +8% (XB +14% but lower FX volatility vs PY) |
| Other revenue | $1.647B | — | +40% (advisory / marketing VAS + pricing) |
| Client incentives | $(5.123)B | — | +21% — the nitpick |
| Non-GAAP opex | $4.051B | — | +12% (marketing + personnel) |
| Non-GAAP op. margin (CNBC/FactSet context) | ~66.6% | FactSet ~66.7% | Essentially inline; CNBC flagged slight soft |
| Payments volume (CCD) | +9% | FY +9% | US PV +10%; US credit +11%, debit +9% |
| XB ex Intra-EU (CCD) | +14% | FY +12% | Travel +13%; XB e-com +17% |
| Processed transactions | 74.2B (+10%) | FY 281.3B (+9%) | Throughput intact |
| Cash + investment securities | $14.2B | — | Balance-sheet dry powder |
| Diluted Class A share count | 1.88B | FY 1.91B | Buybacks doing work |
Full-year scorecard (fiscal year ended September 30, 2026):
| Metric | FY26 | YoY |
|---|---|---|
| Net revenue | $45.903B | +15% (+14% CCD) |
| GAAP NI / EPS | $23.504B / $12.32 | +17% / +21% |
| Non-GAAP NI / EPS | $25.314B / $13.27 | +12% / +16% |
| Client incentives | $18.317B | +16% |
| Non-GAAP opex | $14.919B | +16% |
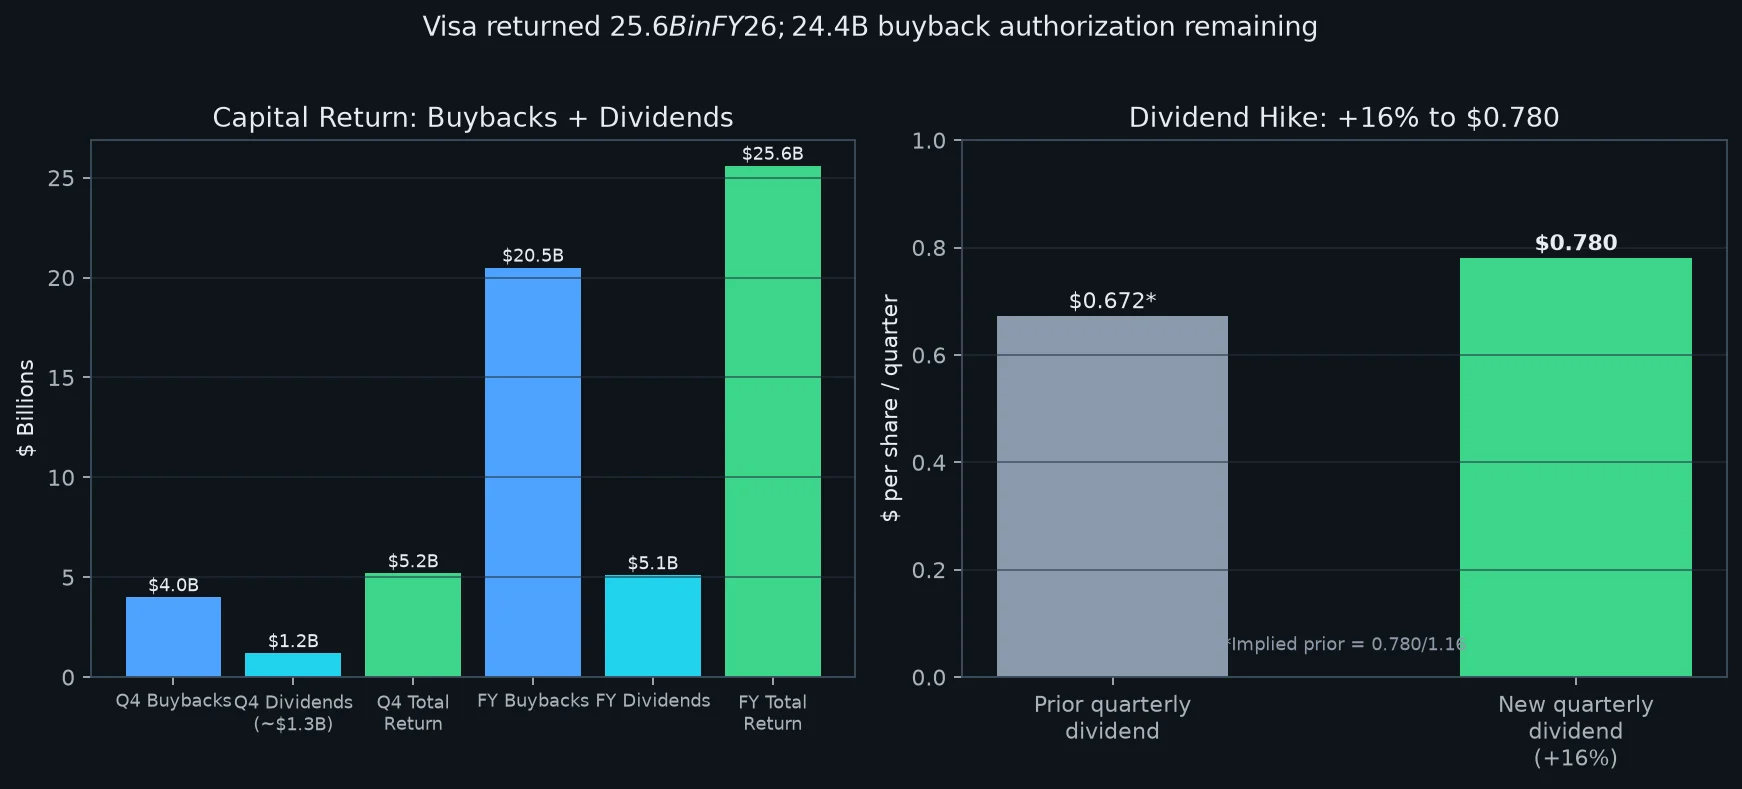
| Cap return (buybacks + dividends) | $25.6B | Q4 alone $5.2B |
| Buybacks | ~$20.5B (~61M shares @ ~$335.49) | Q4: ~11M @ $369.12 → $4.0B |
| Remaining buyback authorization | $24.4B | as of Sep 30, 2026 |
Three traps in the scorecard:
Trap one — GAAP looks cleaner than the underlying beat narrative. Q4 GAAP includes a $469M MDL litigation provision, $282M Visa Foundation investment donation, and $37M deferred tax expense from a change in U.S. taxation of certain foreign earnings — plus equity-investment gains and acquisition amortization. Non-GAAP is the right lens for run-rate; do not let the +22% GAAP EPS growth imply the franchise suddenly re-accelerated beyond what volume drivers show.
Trap two — international transaction revenue under-grew cross-border volume. XB ex Intra-EU +14%, but international transaction revenue only +8%, “primarily due to lower volatility levels than last year and mix.” That is a real FX/volatility drag, not a volume miss — and Suh guided FY27 volatility “generally consistent with Q4 of 2026,” which implies a full-year drag, with Q2 the largest and Q1 a slight benefit.
Trap three — acquisitions padded a point. Prisma and NewPay added roughly ~1 pt to net revenue growth, ~2 pts to opex growth, and ~0.5 pt to EPS growth in Q4. FY27 guide is on an adjusted basis excluding acquisition impacts, and BioCatch ($2.4B cash deal announced August 3, 2026; expected close by end of fiscal Q2’27) is explicitly not in the numbers until close.
3. Revenue mechanics: how $12.1B was actually made
Visa’s net revenue identity is familiar but still worth forcing into prose:
Gross revenue lines − client incentives = net revenue.
In Q4 the gross stack was: service $5.3B (+14%), data processing $6.2B (+16%), international $4.1B (+8%), other $1.6B (+40%). Against that, incentives took $5.1B (+21%). Net: $12.1B (+13%).
Numbers → mechanism → implication
- Service revenue is a lagging volume meter. It is recognized on prior-quarter payments volume. Q3 CCD PV was +10%; service grew +14% — the gap is pricing. That is management executing the pricing plan, not phantom volume.
- Data processing is a current-quarter throughput + mix meter. Processed txns +10%, data processing +16% — again pricing, higher cross-border mix, and VAS riding on the rails.
- Other revenue at +40% is the VAS/advisory tell. Suh: advisory and other VAS, “especially marketing services,” plus pricing — FIFA-year activation is visible here. Do not annualize +40% without FIFA/Olympics calendar context; do respect that VAS is becoming a real P&L pillar (FY VAS ~$14B, +30% CCD; McInerney expects VAS growth low-to-mid 20s in FY27).
- Incentives are the negotiating table, not a leak. Suh on the call: incentives are “a tool that lets us align with a common set of goals and priorities with our partners.” When ~25% of PV renews in a year, the tool gets used more. The bull reads that as duration purchased; the bear reads it as yield given away. Both can be true for a few quarters.
Three growth engines (call framing):
| Engine | Q4 / FY signal | Mechanism |
|---|---|---|
| Consumer payments | US PV +10%; credit +11%, debit +9% | Volume + cross-border + processed txns; spend bands stable |
| CMS (Commercial & Money Movement) | FY +19% CCD; Q4 commercial PV +13% CCD; Visa Direct txns +23% | Commercial growing faster than consumer; Direct endpoints >18B (from 12B in 2025) |
| VAS | FY +30% CCD to ~$14B; Q4 +31% CCD ~$4B | Issuing/acceptance/risk & cyber; Pismo geo expansion; BioCatch pending |
McInerney’s strategic overlay — “trust is the next growth vector” — is marketing language until you map it onto products: tokenization (>50% of credentials tokenized; >60% of e-commerce txns), agentic commerce (nearly 50 AI partners live; Shop Pay; Anthropic collaboration), stablecoin settlement run-rate >$25B annualized (10× YoY), and the pending BioCatch deal to move fraud defense upstream to the account. The investment case for FY27 opex “low double digits” is that these are not optional R&D hobbies; they are the moat-maintenance budget.
4. Management voice: the story they sold
Ryan McInerney (CEO) sold a milestone-year narrative: record ~$46B net revenue, CMS + VAS already >40% of the mix, commercial PV at its fastest annual growth in eight years ex-pandemic, Visa Direct at ~15B transactions / ~$1.5T payments volume for the year, credentials at 5.2B (+6%), seller locations >200M (and >400M including wallets). The forward slogan — “trust is the next growth vector” — is meant to reframe cyber, tokenization, agentic, and on-chain work as revenue architecture, not cost centers.
Chris Suh (CFO) sold the more important spreadsheet story:
- Q4 net revenue +13% “in line with our expectations.”
- EPS +17%, “better than expected primarily due to a lower-than-expected tax rate.”
- Consumer: highest spend band still fastest; no signs of lower-spend consumer weakening.
- Cross-border: Q4 step-up “primarily due to travel”; CEMEA improving; Middle East volumes assumed “generally indexed to where they were in Q4” for FY27 planning.
- Pricing FY27: benefits “similar in magnitude and timing as in 2026,” more back-half loaded.
- Incentives FY27: ~25% of PV renewing → “a step up in the year-over-year growth rate from 2026.”
- FY27 adjusted: NR low double digits; opex low double digits (modestly below NR); non-op expense $250–300M; tax ~19%; EPS low double digits to low teens.
- Q1 FY27: NR low double digits (just under a point below Q4 adjusted), opex low double digits modestly below NR, non-op ~$60M, tax 18.5–19%, EPS growth low end of mid-teens.
- Monthly driver disclosure: will continue through fiscal Q1, then revert to quarterly — a quiet signal that management thinks the pandemic-era “intra-quarter panic” era is over.
The voice is disciplined, almost deliberately unexciting. That is a feature for a network business. It is also why a “low double digit” guide after a 15% year can still produce a −1.4% to −2% after-hours shrug: the market wanted either a consumer scare it could fade, or a guide that extended the FY26 sprint. It got neither.
5. The risk ledger
| Risk | What we know | Why it matters |
|---|---|---|
| Renewal / incentive wave | ~25% of PV renewing in FY27 vs ~20% in FY26; Q4 incentives already +21% | Near-term net revenue yield compression; Street models can undershoot if deal mix is front-loaded |
| FX / volatility drag | Intl txn rev +8% vs XB +14%; FY27 vol “consistent with Q4” → full-year drag | Separates volume optics from revenue optics; Q2 guided as largest drag |
| Tax normalization | Q4 ETR helped by claim-of-right; FY27 ~19% | Part of why EPS guide looks “only” low-teens vs +17% Q4 |
| Consumer band fracture | Management says bands consistent; highest still fastest | Falsifier: lower-band PV deceleration would rewrite the resilience narrative overnight |
| CEMEA / Middle East | Assumed indexed to Q4; travel recovery still incomplete | Cross-border is the high-margin swing factor |
| Regulation / MDL | Q4 $469M MDL provision; $405M litigation escrow deposit (EPS-equivalent to buyback) | Legal is a recurring “special item” that still consumes cash and narrative bandwidth |
| Acquisition integration | BioCatch $2.4B pending; Prisma/NewPay already adding noise to comps | Guide ex-acquisitions; close timing by end FY Q2’27 is a watch item |
| Competitive / A2A / RTP | Not the call’s main scare this quarter | Longer-duration multiple risk if account-to-account displaces card rails faster than VAS offsets |
The ledger’s center of gravity is incentives + guide, not volume. That is unusual for a recession-scare tape and important for portfolio construction: this is a contract-cycle debate dressed in an earnings print.
6. Long vs short debate (named, verified sources)
The short / nitpick case (Seaport — Jeff Cantwell, via Reuters):
“The one thing to nitpick is client incentives, which were above expectations,” Cantwell said, adding the development likely impacted Visa’s fiscal 2027 forecasts. Separately he flagged cross-border as a positive: “XB showed a nice step-up in growth sequentially, and that was one area we were watching for signs of potential weakness going into earnings.” So even the nitpick note is not a consumer-break thesis — it is an incentive/guide thesis.
The constructive / “underwhelmed but intentional” case (KBW — Sanjay Sakhrani et al., via Reuters):
“While some may be underwhelmed by the EPS guide, we think it likely reflects… (the management’s) decision to keep investing in long-term strategic initiatives to extend the durability of top-line growth.” That maps cleanly onto Suh’s own answer to Autonomous’s Ken Suchoski on why EPS growth is not higher: pricing contribution similar to 2026, higher incentive volume from the 25% renewal slate, and continued investment to grow consumer, accelerate VAS and CMS, while still delivering opex growth modestly below revenue.
Call Q&A texture that matters for the debate:
- Wolfe’s Darren Keller put the renewal math in historical context: two bigger renewal years (~20% then ~25%) versus a more typical ~15% per year — and still low-double-digit net revenue growth. Suh agreed with the framing and stressed Visa manages to net revenue growth, inclusive of renewal activity.
- Morgan Stanley’s James Faucette pressed on whether agentic / new money-movement is incremental or substitutional. McInerney: conviction on incrementality (Visa Direct, machine-to-machine, agent-driven discovery), but FY27 P&L impact still very small.
- JPMorgan’s Tien-Tsin Wong asked the visibility question. Suh: approach similar to last year’s initial guide — macro assumptions (resilient consumer) plus execution assumptions (securing large renewals); “balanced” plan with risks and opportunities.
Synthesis of the debate: Bears are not arguing Visa is broken. They are arguing the multiple already prices fortress quality, so a renewal year that spends incentive dollars to lock duration deserves a lower near-term multiple. Bulls are arguing the same dollars buy duration and VAS attach, and that low-double-digit growth at this scale with 66%+ operating margins and $25.6B annual capital return is exactly what compounders are supposed to look like in year N+1 after a 15% sprint.
7. Side plots: Mastercard, dividend, buybacks, BioCatch
Mastercard later this week. Reuters explicitly teed MA as the next read-through. The Visa print sets a high bar on consumer resilience and a tricky bar on incentive intensity. If MA shows soft lower-band spend, Visa’s Suh comment becomes the contested narrative. If MA also prints healthy cross-border and flags a heavy renewal slate, the whole payments complex trades as a contract-cycle story rather than a macro-break story.
Dividend +16% to $0.780 / quarter. Board declaration October 27, payable December 1, 2026 to holders of record November 10, 2026. That is a clean capital-return signal alongside the guide — management is not “saving the dividend” for a rainier day.
Buybacks still industrial. Q4: ~$4.0B (~11M shares @ $369.12) + ~$1.3B dividends = $5.2B returned. FY: buybacks ~$20.5B, dividends ~$5.1B, total $25.6B. Litigation escrow deposit $405M (VWAP $366.81) has the same EPS effect as a Class A repurchase by shrinking as-converted B/C share counts. Authorization remaining: $24.4B.
BioCatch ($2.4B). Behavioral fraud intelligence; >1.8B devices / 760M users protected; 100+ large banks. Expected close by end of fiscal Q2’27 subject to regulatory approvals; financial impact to be updated at close. It is the concrete expression of McInerney’s “move further upstream… where most of the fraud occurs today: at the account level.”
China preparation approval. People’s Bank of China approval of Visa’s application to prepare for domestic processing — a milestone, not a revenue line yet. Long-duration optionality; near-zero FY27 model impact.
8. Braid into one thesis
Visa’s FY26 Q4 is a quality beat wrapped in a duration invoice.
The beat is real: volume drivers solid, cross-border re-accelerated, consumer bands stable, VAS/CMS compounding, capital return undiminished. The invoice is also real: incentives +21% in the quarter, a FY27 renewal slate at ~25% of PV, a guide that steps from mid-teens growth optics to low-double-digit / low-teens, and a tax rate that stops helping.
The right interpretive frame is not “Visa missed” (it did not) and not “Visa guided poorly” (low-double-digit growth at this margin structure is still elite). The right frame is:
Fiscal 2027 is a year Visa chooses to spend contractual currency (incentives) and investment currency (opex) to extend the duration of a network that just proved, again, that consumers are still spending.
If that spend converts into locked share, deeper VAS attach, and stable-to-up volume drivers, the after-hours −1–2% is noise. If incentives rise faster than net revenue for multiple quarters while cross-border or lower-band spend softens, the multiple compresses for fundamental reasons — not vibes.
9. Falsifiable watchpoints
- Incentive ratio / growth vs net revenue. If client incentive YoY stays in the high teens / 20%+ while net revenue sticks at the low end of low-double-digits for several quarters, the bearish yield-compression thesis is winning.
- Renewal outcomes on large clients. Listen for named portfolio wins/losses and whether new deals are broader (VAS + CMS attached), as McInerney claims, or purely price concessions.
- Lower-spend consumer band. Any call language reversing Suh’s “no signs of weakening” is an immediate thesis break for the resilience narrative.
- Cross-border travel, especially CEMEA. FY27 plan indexes Middle East to Q4; a re-escalation or a faster normalization both move the high-margin swing factor.
- FX volatility drag vs guide. International transaction revenue vs XB volume gap is the tell; Q2 is management’s flagged soft spot.
- Q1 FY27 delivery vs “low end of mid-teens” EPS. First clean post-FIFA, post-tax-benefit quarter — the real run-rate check.
- Mastercard’s print. Confirms or challenges the consumer-band and cross-border story within days.
- BioCatch close timing / accretion framing. End of fiscal Q2’27 is the checkpoint; watch whether cyber VAS growth stays in the “sustainable >20%” band McInerney sketched for issuing/acceptance/risk portfolios.
Sources
- Visa Inc. Fiscal Fourth Quarter and Full-Year 2026 Financial Results (SEC EDGAR earnings release, Oct 27, 2026): https://www.sec.gov/Archives/edgar/data/1403161/000140316126000126/q42026earningsrelease.htm
- Visa Q4 FY2026 earnings call transcript (Benzinga / company webcast materials, Oct 27, 2026)
- Reuters via Investing.com: “Visa results beat estimates as resilient customers keep up spending” (Cantwell, Sakhrani quotes; Suh spend-band comments; AH ~−1.4%)
- CNBC: “Stocks making the biggest moves after hours” (Oct 27, 2026) — Visa ~−2% AH; non-GAAP op. margin 66.6% vs FactSet 66.7%
- LSEG / MarketBeat / Alphastreet consensus anchors: non-GAAP EPS ~$3.44; revenue ~$12.09B
- Investing.com earnings-call summary: FY27 guide detail; AH ~$396 (−1.46%)
This article is for informational and educational purposes only and is not investment advice. Figures are sourced from company primary disclosures and reputable wires as of the report date; consensus figures can differ by aggregator.
FAQs
Did Visa beat Q4 FY2026 earnings expectations?
Yes. Non-GAAP EPS was $3.48 vs LSEG consensus near $3.44, and net revenue was $12.139B (+13%) vs Street estimates around $12.09B. Shares still fell about 1.4%–2% after hours on incentives and the FY27 guide.
Why did Visa shares fall after a beat?
Client incentives rose 21% to $5.1B, and management guided FY27 adjusted net revenue growth in the low double digits with EPS growth low-double-digit to low-teens, as roughly 25% of payments volume renews versus about 20% in FY26.
What did Visa say about consumer spending health?
CFO Chris Suh said growth across spend bands remained relatively consistent, the highest band grew fastest, and Visa did not see signs of the lower-spend consumer weakening in volumes.
What is Visa’s FY2027 outlook?
On an adjusted constant-dollar ex-acquisition basis: net revenue growth low double digits; operating expense growth low double digits (modestly below revenue); EPS growth low double digits to low teens; tax rate about 19%.
Related articles
- Stock Market Surges After 2026 Midterms: What the Democratic Sweep Means for Your PortfolioThe stock market rallied after Democrats won the 2026 midterms. Discover what the election means for investors, tech stocks, and the S&P 500 outlook.
- Stock Market Surges After 2026 Midterms: What the Democratic Sweep Means for Your PortfolioThe stock market rallied after Democrats won the 2026 midterms. Discover what the election means for investors, tech stocks, and the S&P 500 outlook.
- Oil Prices Surge Above $105 Amid US-Iran Conflict: Energy Investment Opportunities in November 2026Oil prices climb past $105 as US strikes Iran's Qeshm Island. Discover energy investment opportunities, top oil stocks, and market outlook for November 2026.
- Trump Tariffs on Semiconductors and Solar: A Comprehensive Market Impact Analysis for InvestorsAnalysis of Trump tariffs on key semiconductor and solar panel components, examining impacts on stock markets, supply chains, and investment strategies in 2026.
- 10 AI Trading Bots to Consider in 2026Discover the top 10 AI trading bots for 2026. Compare features, pricing, and AI capabilities of leading automated trading platforms including Alphio AI, Trade Ideas, Intellectia.ai, and more.
- 10 Best AI Crypto Trading Bots (August 2026)Discover the top 10 AI crypto trading bots for August 2026. Compare features, pricing, and performance of leading automated trading platforms including Alphio AI, Pionex, and more.