

S&P 500 Breaks Its 200-Day Moving Average: What History Says and How Investors Should Respond
The S&P 500 just closed below its 200-day moving average for the first time since April. Here's what history says and how investors can respond with rules.

Key Takeaway
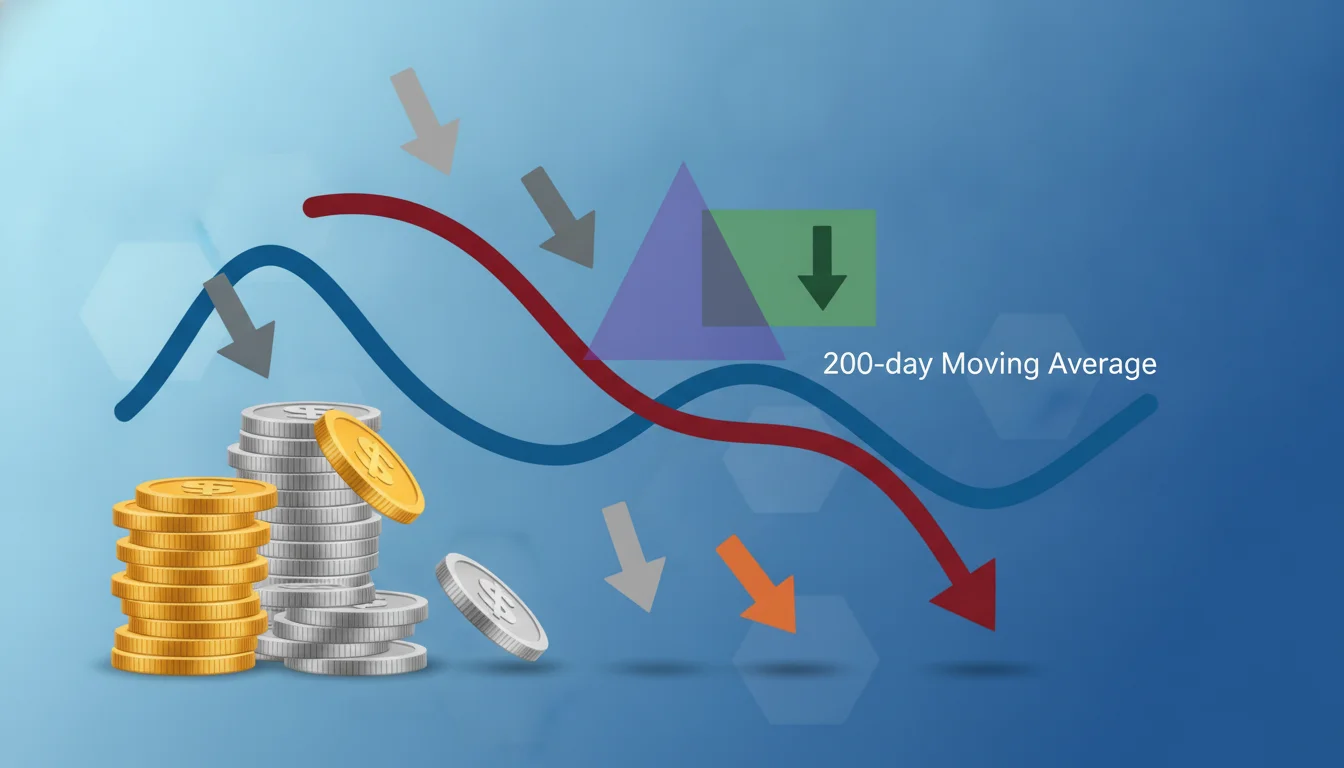
The S&P 500 has lost one of the most widely watched lines on any stock chart. On Tuesday, November 17, 2026, the index closed at 7,340.53, just under its 200-day moving average of 7,346.64, which CNBC reported was its first close below that level since April 7. A day later, on November 18, the index slipped another 0.23% to 7,323.63 for a fifth straight losing session, even as the Nasdaq Composite edged higher. The break ended a run that the Motley Fool tallied at 155 trading days above the average, and it left the S&P 500 roughly 6.5% below the October record near 7,844 cited by TokenPost.
A break of the 200-day moving average is not a crash signal, a recession call, or an automatic reason to sell. Long-run data show it marks a change in the market's risk regime more than a reliable forecast of the next few weeks. Since 1970, according to an analysis published by Stockopedia, the S&P 500 has spent about 28% of its time below the 200-day line, and those stretches delivered lower returns with roughly twice the volatility of the time spent above it. That is useful information, but roughly a third of all such signals have historically turned out to be false alarms.
This guide explains what the 200-day moving average measures, what history says happens after the S&P 500 drops below it, why this particular break comes with an unusual macro backdrop of Fed rate-hike talk and 10-year yields near 5.1%, and how long-term investors, tactical traders, and stock pickers can each turn the signal into rules instead of reactions.
What Just Happened: The S&P 500 Lost Its 200-Day Line
The numbers behind the break
The slide into the 200-day average was gradual rather than violent. CNBC noted that the S&P 500 was down about 3.2% over the month before the break, and the index has now fallen in five consecutive sessions, its longest losing streak since June according to CNBC data cited by StockTitan. On November 18 the Dow Jones Industrial Average lost 561.25 points, or 1.11%, to 50,198.17, while the Nasdaq Composite gained 0.42% to 24,429.88. That split tells you the selling is not uniform: energy was the worst S&P 500 sector on the day, falling 3.5% as WTI crude dropped toward $83, and managed-care stocks such as UnitedHealth and Humana fell by double digits on regulatory worries.
What makes the break notable is less its size than its location. The S&P 500 is sitting only a fraction of a percent below its 200-day average, which means a single strong session could put it back above the line. Technicians therefore tend to watch whether the index closes below the average for several days in a row, and whether the average itself starts to roll over and slope downward.
Why this week's macro backdrop matters
The context around this break is unusually hawkish. Minutes from the Federal Reserve's October 27–28 meeting, released on November 18, showed that almost all officials judged further rate increases would likely be appropriate, after the Fed held its policy range at 3.75% to 4% in October. Two voters, Lisa Cook and Beth Hammack, preferred a quarter-point hike at that meeting, and Governor Christopher Waller has said a half-point increase was "probably needed" at the December 8–9 meeting, according to StockTitan's report. Meanwhile the 10-year Treasury yield finished the day around 5.1%, with the Motley Fool citing 5.10% and Investopedia 5.07%.
Higher discount rates make expensive growth stocks especially sensitive, and TokenPost reported that the information technology sector was down more than 15% since the fourth quarter began. When a trend signal lines up with a tightening Fed, investors should give it more weight than they would during an easing cycle, a point we return to below.
What the technicians are watching
Jonathan Krinsky, chief market technician at BTIG, told CNBC the index had made "one too many tests" of support and suggested the next stop "might be the 7,000-7,100 zone." TokenPost reported that the S&P 500 had tested a 7,250–7,350 support band five times since early June. Not everyone is bearish: CNBC said JPMorgan's market intelligence desk described itself as tactically bullish on stocks. That disagreement is the honest state of play, and it is exactly why a rules-based approach matters more than a headline.
What the 200-Day Moving Average Actually Measures
The simple math
The 200-day simple moving average is the arithmetic mean of the last 200 daily closing prices, roughly 40 weeks or about nine and a half calendar months of trading. Each day the oldest close drops out and the newest one is added, so the line moves slowly and smooths out day-to-day noise. When price is above the line, the market is trading higher than its average level of the past ten months, which is the most basic definition of an uptrend. When price falls below it, recent prices are lower than the longer-run average, and momentum has at least paused.
Because it is calculated the same way by every charting platform, the 200-day average is something close to a shared reference point. That matters, because a level that millions of participants watch can become partly self-fulfilling: systematic funds, risk-parity desks, and discretionary managers often adjust exposure when it is crossed.
Why so many investors watch it
The line has a long and colorful following. Paul Tudor Jones is widely quoted, including in Stockopedia's March 2026 analysis, saying "nothing good happens below the 200 day moving average." The appeal is simplicity: one number, checkable in seconds, that separates periods when the trend is your friend from periods when it is not.
It is also a convenient yardstick for breadth. Analysts frequently track the percentage of S&P 500 members trading above their own 200-day averages to judge whether a rally is broad or carried by a handful of mega-caps. A falling share of stocks above their 200-day lines while the index holds up is a classic warning sign of narrowing leadership.
SMA, EMA, and the 10-month cousin
Some investors prefer an exponential moving average, which weights recent prices more heavily and reacts faster, at the cost of more false signals. Others use a monthly version. Mebane Faber's well-known paper, "A Quantitative Approach to Tactical Asset Allocation," first published in 2007 and updated in 2013, uses a 10-month simple moving average checked only at month-end. Ten monthly closes cover roughly the same span as 200 daily closes, but evaluating the signal once a month dramatically cuts the number of trades and the risk of getting whipsawed by a single bad week.
What History Says About Trading Below the 200-Day
Regime returns: lower gains, higher volatility
The strongest evidence for the 200-day line is about risk, not about predicting direction. In Stockopedia's study of S&P 500 data since 1970, the index spent about 72% of the time above its 200-day average, earning an annualized return of +9.7% with 13.1% volatility. During the 28% of the time it spent below the line, the annualized return was +4.1% with volatility of 25.0%. Buy-and-hold over the whole period returned about +8.1% a year with 17.3% volatility.
Notice that returns below the line were still positive on average. The difference is that the ride was nearly twice as bumpy, and that most of the market's worst days, including crash-like sessions, have clustered in below-average regimes. For an investor, that is a reason to review risk and position sizing, not necessarily to exit.
What Faber's timing study found
Faber's 2013 update, as summarized by CXO Advisory, tested a simple rule on the S&P 500 from 1901 through 2012: hold stocks when the index is above its 10-month average at month-end, otherwise hold cash. Gross of costs and taxes, the timing model returned about 10.2% a year versus 9.3% for buy-and-hold, with annual volatility of 12.0% versus 17.9%. The biggest benefit was in drawdowns, with a maximum loss of about 50.3% versus 83.5% for buy-and-hold.
The same summary is candid about limits. Calculations ignored trading frictions and taxes, and Faber himself acknowledged that data-snooping bias from choosing a 10-month window may be material for U.S. stocks. Over the long 1940–2000 subperiod, the timing rule did not widen its gap with buy-and-hold. In other words, the rule earned its keep mostly in a few deep bear markets, such as the 1930s and 2008, and was roughly a wash the rest of the time.
The false-signal problem
Whipsaws are the price of admission. Stockopedia counted 369 daily 200-day signals in 56 years of S&P 500 history versus 81 using Faber's monthly approach, and estimated that about 31% of signals were false. The Early Retirement Now blog, which studied the 10-month rule back to 1871, found that the model produced plenty of false alarms during economic expansions, citing a sell signal in August 2015 that was followed by a rally. Its successful sell signals, by contrast, clustered around recessions.
That pattern gives investors a practical filter: a 200-day break during a healthy economy is more likely to be noise, while a break accompanied by tightening financial conditions or deteriorating economic data deserves more respect.
Not Every Break Is Alike: Context That Changes the Signal
Rates and the Fed: the 2022 lesson
The best recent example of a 200-day break that mattered is 2022, when the Fed was raising rates aggressively and the S&P 500 fell about 19% for the year. Trend signals worked well in that environment because the driver of the decline, rising real yields, persisted for months. Today's setup rhymes in one important way: Fed minutes point toward more hikes and the 10-year yield sits above 5%. Investors should not assume 2022 repeats, but a tightening cycle is the context in which trend breaks have historically carried the most information.
Breadth and leadership: watch the Nasdaq and the mega-caps
This break is unusual because the Nasdaq Composite rose on November 18 while the Dow fell more than 1%, a sign that rotation rather than wholesale liquidation is still in play. Still, the technology sector's decline of more than 15% since early October is the main reason the cap-weighted S&P 500 lost its line, since the largest companies carry the biggest index weights.
Investors can learn a lot by comparing the cap-weighted index with an equal-weight version and with the share of stocks above their own 200-day averages. If the average stock holds up while mega-caps fall, the break is mostly a leadership problem; if both deteriorate together, the signal is broader and more serious.
Duration and depth: one close is not a trend
Many systematic traders require confirmation, such as three consecutive closes below the line, a close more than 1% to 3% below it, or a downward-sloping average, before acting. The S&P 500 broke through its 200-day average in March 2026 as well, according to Stockopedia, before recovering to set records in October. That episode is a fresh reminder that breaks often reverse, and a confirmation filter is the simplest defense against reacting to a one-day dip.
How Different Investors Can Use the Signal
Long-term investors: a cue to rebalance, not to flee
For investors with a decade-plus horizon, the 200-day break is best treated as a prompt for a portfolio check-up. Is your stock allocation drifting above target after a strong multi-year run? Do you hold enough cash or short-term bonds to cover near-term spending so you are never forced to sell into weakness? With money-market yields still attractive in a rising-rate environment, the opportunity cost of holding an appropriate reserve is lower than it was a few years ago. What long-term investors should avoid is turning a technical signal into an all-or-nothing bet.
Tactical and trend-following investors: define the rule in advance
Investors who do want to use the 200-day line actively should write the rule down before the next signal arrives. That means deciding which index or fund you will measure, whether you use daily or month-end closes, what confirmation filter you require, how much exposure you cut (a full exit, or a reduction from, say, 100% to 50%), and what condition brings you back in. A partial rule tends to be easier to stick with than an all-in, all-out switch because the cost of a false signal is smaller.
Disciplined execution is where most trend-followers fail, because the signal often fires on days when the news feels either terrifying or reassuring. Alphio's Scheduled Task feature lets you set recurring checks, such as a month-end review of whether the S&P 500 sits above its 200-day average, so the decision is made on a schedule rather than in the heat of a sell-off.

Stock pickers: index trend versus company fundamentals
A falling index does not mean every company's valuation is broken. Individual stocks have their own 200-day lines, and some leaders slip below theirs on index-level selling even when earnings are still rising. Nvidia is a live example: the stock fell about 2.9% on November 18 despite strong quarterly results, as investors weighed leadership questions and new export restrictions. For individual names, it helps to pair the trend signal with a valuation check rather than treating the chart in isolation.
When a quality company with improving estimates trades below its 200-day line during a broad market pullback, it can become a watch-list candidate rather than an automatic sell. When a company's fundamentals and its chart are deteriorating together, the trend signal deserves more weight.
Building a 200-Day Rule That Survives Real Life
Check monthly, act deliberately
The research above points to one clear conclusion: evaluating the signal at month-end cuts trading activity dramatically while preserving most of the drawdown protection. It also prevents a single headline-driven session from forcing a portfolio decision.
Practical guardrails
A workable rule usually includes a handful of components, and writing them down is half the value:
- Use a buffer, for example acting only when the index closes 2% or more below its 200-day average at month-end, to filter shallow breaks.
- Scale exposure in steps rather than going from fully invested to zero.
- Decide in advance where the proceeds go, such as Treasury bills or a short-duration bond fund.
- Set a re-entry condition that mirrors the exit, so you are not stranded in cash after a V-shaped recovery.
- Log every signal and its outcome so you can judge the rule over years, not weeks.
Taxes, costs, and opportunity cost
Every academic backtest of moving-average timing quotes returns before taxes and trading costs. In a taxable account, selling long-held winners can trigger capital-gains taxes that wipe out the benefit of avoiding a modest decline. That is why the Early Retirement Now author said they would avoid selling large quantities of stocks in taxable accounts and would consider such rules within tax-advantaged accounts. Missing a sharp rebound is the other hidden cost: some of the market's best days historically arrive close to its worst ones, often while prices are still below the 200-day line.
Common Mistakes When the 200-Day Line Breaks
Treating a trend signal as a forecast
The most frequent error is reading the break as a prediction that stocks must fall further. History says something more modest: below-average regimes have lower average returns and higher volatility, but plenty of breaks reverse quickly. Krinsky's 7,000–7,100 zone is one technician's scenario, not a certainty, and JPMorgan's tactical desk was leaning the other way at the same time.
Ignoring position sizing and diversification
The 200-day line says nothing about how concentrated your portfolio is. An investor holding a handful of AI-related stocks faces a very different risk from someone in a diversified mix of U.S. and international equities, bonds, and cash. Before reacting to an index signal, check what you actually own and how much of it moves together. Company-level research, including analyst consensus and fundamentals, helps distinguish a stock that is cheaper for a good reason from one that is simply caught in the tide.
Abandoning the plan mid-signal
Investors also tend to modify their rules in real time, tightening them after a loss and loosening them after a missed rally. That is how a disciplined process turns into discretionary guessing. If you want to explore scenarios, such as how your portfolio would look with lower equity exposure, a research conversation is a better outlet than a hurried trade. Alphio's Conversational Trading lets you ask questions about positions, trends, and risk in plain English before you decide whether to act.
Conclusion
The S&P 500's first close below its 200-day moving average since April is a meaningful change in market character, arriving alongside a hawkish Fed, a 10-year yield near 5.1%, and a sharp pullback in technology leadership. History suggests that time spent below the line tends to mean lower returns and much higher volatility, which is a good reason to revisit allocations, cash reserves, and risk limits. It does not justify panic: roughly a third of 200-day signals have been false alarms, and the index already recovered from a similar break in March 2026.
The investors who handle moments like this best are the ones who decide their rules before the signal arrives and then follow them consistently. Whether you rebalance on a schedule, scale exposure with a month-end trend filter, or simply stay the course with a diversified portfolio, the key is that the process, not the headline, drives the decision. If you want help executing a rules-based approach, Alphio's Autonomous Trading can run predefined strategies within the limits you set, while Copy Trade lets you follow experienced traders' approaches with transparent position sizing. Neither removes market risk, so set your guardrails first and let the tools handle the discipline.
FAQs
What does it mean when the S&P 500 falls below its 200-day moving average?
It means the index is trading below its average closing price of roughly the past 10 months, which technicians treat as a sign that the long-term uptrend has paused. Historically, periods below the line have delivered lower average returns with much higher volatility, but many breaks have reversed within weeks.
When did the S&P 500 last fall below its 200-day moving average?
On November 17, 2026, the S&P 500 closed at 7,340.53, just below its 200-day average of 7,346.64, its first close below that line since April 7, according to CNBC. The index fell further to 7,323.63 on November 18, extending a five-session losing streak.
Should I sell stocks when the S&P 500 breaks its 200-day moving average?
Not automatically. Research such as Mebane Faber's 10-month moving average study shows trend rules mainly reduce drawdowns in deep bear markets, while generating many false signals and ignoring taxes and trading costs. Long-term investors often use the break as a prompt to rebalance rather than a reason to exit.
How reliable is the 200-day moving average as a market signal?
It is a useful risk gauge but an imperfect timing tool. A Stockopedia analysis of S&P 500 data since 1970 estimated that about 31% of signals were false, and checking only at month-end cut the number of signals from 369 to 81 over 56 years.
What is the difference between the 200-day and the 10-month moving average?
Both cover roughly the same span of time, but the 200-day average uses daily closes while the 10-month average uses month-end closes. The monthly version is checked less often, which reduces trading and whipsaws at the cost of reacting more slowly to sharp moves.
Related articles
- Leveraged ETFs in the 2026 Sell-Off: Why TQQQ and SOXL Dip Buyers Got Crushed by Volatility DecayLeveraged ETFs like TQQQ and SOXL fell hard in the 2026 sell-off. Learn how daily resets and volatility decay work, and how to size and time-box 3x trades.
- Dividend Stocks vs 5% Treasury Yields: How Income Investors Should Adapt in 2026With 10-year Treasury yields above 5% and the S&P 500 yielding about 1.1%, here is how to judge dividend stocks, avoid yield traps, and build income in 2026.
- Roth Conversion in a Down Market: How to Use the 2026 Sell-Off Before December 31Stocks fell 8% from their high. Learn how a Roth conversion in a down market works, how to size it with 2026 tax brackets, and the traps to avoid by Dec 31.
- Oil Prices Surge as Hormuz Crisis Deepens: What Investors Need to Know in August 2026Oil prices surge amid Strait of Hormuz closure. Analyze the impact on energy stocks, inflation, and Federal Reserve policy. Expert insights for investors.
- Nvidia Stock Earnings August 2026: Q2 FY2027 Preview and Investment StrategyNvidia reports Q2 FY2027 earnings on August 26, 2026. Wall Street expects $93-95B revenue. Explore analyst price targets, Blackwell chip impact, and investment strategies.
- Gold Price Forecast August 2026: Is $6,000 Gold Still Within Reach?Expert analysis on gold price predictions for August 2026. Discover key factors driving precious metals and investment strategies for the current market environment.