

Bitcoin Bear Market 2026: Why BTC Fell Below $70K and How Investors Can Manage Crypto Risk
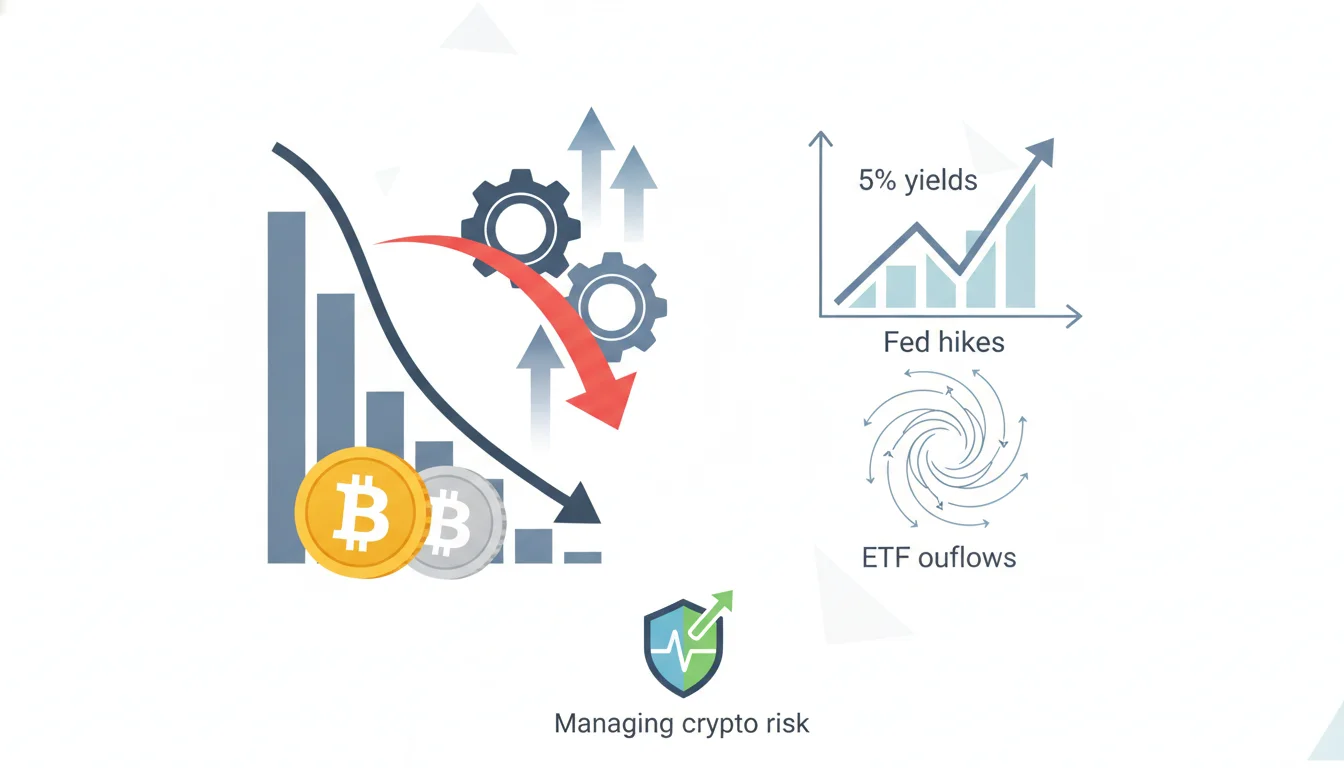
Bitcoin is about 45% below its $126K peak as Fed hikes, 5% yields and ETF outflows bite. See how the 2026 bear market compares and how to manage crypto risk.

Key Takeaway
Bitcoin has spent most of the past year proving that a bear market in crypto rarely moves in a straight line. According to Fortune's daily price data, bitcoin traded at $69,134.72 at 8:30 a.m. ET on November 13, 2026, down 5.56% in a single day, roughly 15% lower than a month earlier and about 31% below where it stood a year ago. The world's largest cryptocurrency peaked at $126,198.07 on October 6, 2025, which means it was sitting about 45% below its all-time high, a drawdown that comfortably qualifies as a bear market by any conventional definition. It is not even the low of this cycle: bitcoin briefly fell to about $59,930 in February 2026 and to roughly $58,000 in late June, according to Cointelegraph and The Block.
The latest leg down has a distinctly macro flavor. The Federal Reserve raised rates by a quarter point on September 16, 2026, its first hike since 2023, and kept the federal funds target range at 3.75% to 4.00% on October 28 with two officials dissenting in favor of another increase. October consumer prices rose 0.4% for the month, hotter than the 0.3% forecast, and the 10-year Treasury yield touched 5.02% afterward. Add the November 5 AI-stock wipeout, when the S&P 500 fell 4.36% and the Nasdaq dropped 5.5%, plus about $1.09 billion of crypto liquidations that day, and the pressure on risk assets is easy to see.
This guide explains what the 2026 bitcoin bear market looks like in context, how it compares with the 2014, 2018 and 2022 cycles, how spot bitcoin ETFs and crypto stocks transmit the pain to ordinary portfolios, and how investors can build rules for sizing, rebalancing and reviewing crypto exposure. Prices are as of November 13, 2026 (America/New_York) unless noted. Nothing here is personalized investment advice, and past crypto cycles do not guarantee future outcomes.
How Deep Is the 2026 Bitcoin Bear Market?
From a $126,000 peak to below $70,000
The cleanest way to measure a bear market is peak-to-current drawdown. Using Fortune's data, bitcoin's October 6, 2025 record of $126,198.07 and its November 13, 2026 price of $69,134.72 imply a decline of roughly 45%. The slide did not begin this autumn. Fortune notes that bitcoin finished 2025 roughly 30% below its October high, so the market entered 2026 already wounded, and the selling has come in waves rather than one cascade.
Bitcoin traded at about $83,400 on October 13, 2026, according to Fortune, and was still above $73,000 on November 12 before a single-day drop of more than 5% pushed it under $70,000. For holders, it feels less like a crash than a staircase lower, where each rally attracts sellers relieved to get out near their entry price.
The lows that already happened this year
It is easy to forget that the cycle low may already be behind us, or may not. Cointelegraph reported that bitcoin hit $59,930 in February 2026, its lowest level since October 2024, and The Block reported a brief slide to about $58,200 on June 25, 2026. Measured from the October 2025 peak, those lows represent drawdowns in the low-to-mid 50% range. In other words, today's level sits above the year's troughs even though the November decline feels acute.
This is a useful reminder that drawdown numbers depend heavily on the reference point. Someone who bought at the February low is roughly 15% ahead; someone who bought near the 2025 peak is nursing a loss of almost half. Analysts' projected bottoms vary too. Fortune reported in July that Grayscale's Zach Pandl saw a possible bottom near $58,000, while CryptoQuant's Julio Moreno framed $56,000 to $60,000 as a bottoming zone. Those are projections, not promises, and they were made before the latest macro shock.
The Macro Forces Pressuring Bitcoin
A Fed that is hiking, not cutting
The single biggest difference between this bear market and the bull run that preceded it is monetary policy. On September 16, 2026, the Fed raised its benchmark rate by 25 basis points, its first increase in three years, with AP reporting that Chair Kevin Warsh said "inflation is too high and has been for too long." On October 28 the central bank held the target range at 3.75% to 4.00% in a 10-2 vote, with Governors Cook and Hammack dissenting in favor of another quarter-point hike, according to the Fed's statement.
Higher policy rates hurt bitcoin through several channels. They raise the return on cash and Treasury bills, which makes a non-yielding asset less attractive. They tighten financial conditions and reduce the speculative liquidity that has historically fueled crypto rallies. And they push up the cost of leverage, which matters enormously in a market where futures and perpetual swaps amplify every move. Cointelegraph reported on November 11 that futures markets were pricing a quarter-point hike at the December meeting, with odds of a larger move rising.
Hot inflation and 5% Treasury yields
The October CPI report, released November 10, showed headline consumer prices up 0.4% for the month versus a 0.3% forecast, with core prices up 0.3%. The data reinforced the idea that the Fed is not finished. Bond markets reacted quickly: the 10-year Treasury yield reached 5.02% and the 30-year climbed to about 5.38%, according to Cointelegraph's November 11 market report. A Dow Jones report in late September had already noted that the 10-year yield crossing 5% was a first since 2007.
When government bonds pay 5%, the opportunity cost of holding a volatile asset with no cash flows rises sharply, raising the bar for new buyers. Rising yields also tend to support the US dollar, and a strong dollar has historically coincided with weaker crypto prices, because global liquidity tightens when dollar funding gets more expensive.
The AI stock sell-off spilled over
Bitcoin increasingly trades alongside high-growth technology stocks during risk-off episodes. On November 5, 2026, AP reported that the S&P 500 fell 334.89 points to 7,353.73 and the Nasdaq dropped 5.5% as investors dumped AI stocks, with Nvidia down 9.3%, on worries about data-center restrictions after the midterm elections. The Block reported that bitcoin fell about 6% to $75,700 that same day and that crypto liquidations reached roughly $1.09 billion over 24 hours, hitting about 211,000 traders, citing CoinGlass data.
Many of the same funds and retail traders hold both AI leaders and crypto, and when margin calls arrive they sell what they can. Investors who own both should treat them as one combined risk bucket rather than as diversifiers that offset each other.
How 2026 Compares With Past Crypto Winters
Three prior cycles, three deep drawdowns
Bitcoin's history is a sequence of manias and hangovers. According to K33 Research, the 2014 to 2015 bear market produced a drawdown of about 85% over 407 days from peak to bottom. The 2018 decline, which followed the December 2017 peak near $20,000, reached roughly 84% over 364 days, with prices bottoming around $3,200. The 2021 to 2022 cycle took bitcoin from roughly $69,000 in November 2021 to about $15,500 in November 2022, a loss of around 77% over 376 days.
Against that backdrop, a 45% to 54% drawdown looks shallower than past crypto winters. One explanation is a changed investor base: spot ETFs, corporate treasuries and pension-adjacent buyers have broadened ownership, which may dampen extremes. Another is simply that the cycle is not over. Investors should be careful about assuming that institutional adoption has permanently capped downside, because that assumption has not been tested through a full multi-year tightening cycle.
What triggered the old bottoms
Past bottoms usually coincided with a capitulation event. In November 2022, the collapse of FTX forced a final wave of selling that pushed bitcoin to roughly $15,500, according to Decrypt and CoinGecko data. In 2018, a prolonged grind and miner stress preceded the trough. The common thread was forced selling by leveraged or distressed holders, followed by a long period of dull, range-bound trading.
The 2026 market has had its own stress points, including repeated liquidation cascades and, according to The Block, post-midterm uncertainty around crypto market-structure legislation. On November 10, Cointelegraph reported that short-term holders sent more than 47,000 BTC to exchanges at a loss as price fell through their roughly $75,700 cost basis. Loss-taking by recent buyers is a classic bear-market signature, though it is not by itself proof of a final bottom.
The halving cycle argument
Many crypto investors frame markets around the four-year halving cycle. The most recent halving occurred on April 19, 2024 (April 20 UTC), at block 840,000, cutting the block reward from 6.25 to 3.125 BTC, according to The Block. Historically, bitcoin peaked roughly 12 to 18 months after a halving and then entered a bear market, a pattern the October 2025 peak fits loosely. But cycle models rest on a handful of observations, and a Fed hiking into 5% bond yields is very different from the zero-rate world of 2020 and 2021. Treat the halving narrative as one input to sentiment, not a calendar that guarantees a recovery date.
Spot Bitcoin ETFs: How the Slump Reaches Mainstream Portfolios
Outflows have accelerated
Spot bitcoin ETFs, which launched in January 2024, turned bitcoin into something investors can hold in a brokerage or retirement account. That convenience also makes ETF flows a real-time sentiment gauge. Cointelegraph, citing Farside data, reported that US spot bitcoin ETFs lost a net $398.6 million on November 2, 2026, including $405.3 million from BlackRock's iShares Bitcoin Trust (IBIT), its largest outflow since June. October as a whole saw net outflows of about $515 million.
The selling continued into the following week. Crypto Briefing reported further outflows of $430.2 million on November 5 and $411.9 million on November 6, with roughly $1.28 billion leaving in the week to November 7, the worst week since June. Even so, the same report estimated cumulative net inflows of roughly $55 billion since launch, which suggests most long-term ETF holders have not abandoned the asset.
ETF versus owning the coin directly
For most investors, the ETF wrapper's main advantages are simplicity, custody handled by regulated firms, and the ability to hold bitcoin alongside stocks and bonds for rebalancing. The trade-offs are annual fees, trading only during market hours, and no ability to move the coins on-chain. Direct ownership offers 24/7 trading and self-custody, but it shifts security responsibility to you and can complicate tax record-keeping. Because bitcoin trades on weekends, ETF shareholders can also face Monday gaps they could not react to.
Using ETFs to enforce discipline
An ETF also fits neatly into an allocation framework: if your plan says crypto should be 3% of the portfolio, the weight is visible next to everything else and rebalancing becomes a routine trade. Investors who want reminders rather than impulses can set calendar-based check-ins, for example reviewing crypto weight after each Fed meeting or at month-end, using Alphio's Scheduled Task workflows to automate the monitoring once the rules are written down.

Crypto Stocks: Leverage to the Bitcoin Price
Strategy's treasury model under pressure
Strategy (MSTR), formerly MicroStrategy, is the purest equity proxy for bitcoin. According to The Block, the company held 850,364 BTC after buying another 1,036 coins between November 2 and 8, 2026, at a total cost of about $64.2 billion, or an average of $75,456 per bitcoin. With bitcoin trading near $69,000 on November 13, that stake was below its average purchase price, a shift that changes how investors value the company.
When bitcoin rises, Strategy's shares have often gained even more because the market assigns a premium to its ability to raise capital and buy more coins. In a falling market, that premium can compress and the stock can fall faster than bitcoin. Fortune reported in July that the shares were down about 75% from October 2025. MSTR closed at $128.93 on November 6, according to The Block.
Coinbase: trading volumes and investment marks
Coinbase (COIN) earns most of its money from trading fees, custody and subscription services, so its revenue tends to track crypto activity. In its third-quarter 2026 results, reported October 29, Coinbase posted net income of about $719 million, but roughly $715 million of that came from gains on its crypto investment portfolio, and adjusted net income was about $78 million, according to Bitcoin.com News. The gap between headline and adjusted profit shows how much reported earnings depend on crypto prices.
Coinbase is a cyclical business tied to sentiment, and sustained bear markets usually reduce retail participation. Both MSTR and COIN fell about 10% on November 5, The Block reported, roughly in line with or worse than bitcoin itself.
Robinhood and the retail barometer
Robinhood (HOOD) offers another window into retail crypto appetite. According to Decrypt, Robinhood's third-quarter 2026 crypto revenue fell 55% from a year earlier to $120 million, and crypto notional volume dropped 38% to about $50 billion. Total revenue was $1.42 billion, and earnings per share of $0.51 missed the $0.55 estimate, sending the stock down about 6% after hours.
The lesson is that crypto stocks do not avoid bitcoin risk; they add business, financing and valuation risk on top of it, and owning them alongside a spot ETF concentrates you further in the same theme.
Building a Risk Framework for Crypto in a Bear Market
Size positions for an 80% drawdown
The most practical lesson from bitcoin's history is to size positions as if an 80% decline is possible, because it has happened three times. If losing 80% of your crypto allocation would derail your financial plan, the allocation is too large. Oversized investors tend to sell near bottoms because the losses become unbearable, while appropriately sized investors can hold, rebalance or ignore the noise. Writing down your maximum crypto weight before the next big move is one of the most effective risk controls available.
Rebalance with rules, not feelings
Rebalancing forces you to buy what has fallen and trim what has risen, which is the opposite of what fear and greed encourage. A simple rule, such as bringing crypto back to its target weight when it drifts more than a set percentage, keeps the position from ballooning in a bull market or vanishing in a bear market. Rebalancing on a schedule, such as quarterly, works too. Selling a losing position can also realize capital losses that may offset gains elsewhere, depending on tax law and your situation, so check with a tax professional.
Know what would change your mind
Before adding exposure in a bear market, list the signals that would make you more or less confident. Constructive signs might include a pause or reversal in Fed tightening, falling Treasury yields, a sustained return of ETF inflows, or clearer regulation. Warning signs might include further hikes, new liquidation cascades, or forced selling by large holders. This checklist turns vague hope into something you can monitor and reduces the temptation to anchor on the old $126,000 high.
Strategies Investors Use During a Crypto Downturn
Dollar-cost averaging into weakness
Dollar-cost averaging means investing a fixed amount on a regular schedule regardless of price. In a volatile bear market, it lowers the risk of committing a large lump sum right before another leg down. It does not guarantee a profit or protect against loss, and it can lag a lump-sum investment if prices recover quickly, but it suits investors who believe in long-term adoption yet cannot predict the bottom. Pair it with a ceiling, though, or steady buying in a falling market can quietly turn a small position into a large one.
Staying patient and doing nothing
For long-term holders who are already at their target allocation, doing nothing is a legitimate strategy. Bear markets in crypto have historically lasted around a year from peak to trough, followed by extended sideways periods. Constant trading in that environment often generates fees and taxes more than returns.
Patience is easier when you have a clear process for asking questions and checking facts rather than reacting to social media. Tools like Alphio's Conversational Trading let you ask follow-up questions about ETF flows, crypto stocks or macro data in plain language, as a research aid rather than a substitute for your own plan.

Hedging and the limits of shorting
Sophisticated traders sometimes hedge bitcoin exposure with futures, options or inverse products. These tools can reduce risk but come with costs, margin requirements and timing risk, and inverse or leveraged ETFs can decay over time. Shorting bitcoin in a bear market is also hazardous, because sharp relief rallies are common and can force short sellers to cover at a loss. For most investors, the simpler hedge is a smaller position and a diversified core of cash, bonds and broad equity funds.
Conclusion
The 2026 bitcoin bear market is real: prices sit roughly 45% below the October 2025 peak, spot ETF outflows are running at their fastest pace since June, and crypto stocks such as Strategy, Coinbase and Robinhood are reflecting lower volumes and compressed premiums. The main drivers are macro rather than purely crypto-specific, with a hiking Fed, hot inflation and 5% Treasury yields raising the bar for every speculative asset, and the November 5 AI sell-off showing how tightly bitcoin now trades with tech.
History says crypto winters can be deeper and longer than most investors expect, and it also says they end. The investors who come through them in good shape are usually the ones who sized positions modestly, rebalanced with rules, and focused on signals like Fed policy, yields and ETF flows instead of price predictions. That process is more important than calling the exact bottom.
If you want to turn that discipline into a repeatable workflow, Alphio's Autonomous Trading can execute strategies within risk limits you define, while Copy Trade lets you study and follow how experienced traders position through volatile markets. Use them after your allocation, risk limits and review schedule are written down, and remember that no tool removes the risk of investing in crypto.
FAQs
Is bitcoin in a bear market in 2026?
By the usual definition, yes. Bitcoin traded at about $69,135 on November 13, 2026, according to Fortune, roughly 45% below its all-time high of $126,198 set on October 6, 2025. It also hit lower levels near $60,000 in February and about $58,000 in June 2026.
Why is bitcoin falling in November 2026?
The main pressures are macro. The Fed raised rates in September 2026 and signaled more tightening, October CPI came in hotter than expected, and the 10-year Treasury yield touched about 5%. A sharp AI-stock sell-off on November 5, crypto liquidations and spot ETF outflows added to the selling.
How long do bitcoin bear markets usually last?
According to K33 Research, the 2014-15, 2018 and 2021-22 bear markets each lasted roughly 364 to 407 days from peak to bottom, with drawdowns of about 77% to 85%. Recoveries afterward have often included long sideways periods, and past cycles do not guarantee how the current one will unfold.
Are spot bitcoin ETFs safer than owning bitcoin directly?
Spot bitcoin ETFs carry the same price risk as bitcoin itself, but they simplify custody, record-keeping and rebalancing inside a brokerage account. The trade-offs are management fees and trading only during market hours, while bitcoin trades 24/7.
How much bitcoin should I hold during a bear market?
There is no universal answer, but a common rule is to size crypto as if an 80% decline is possible, since bitcoin has suffered drawdowns of that scale three times. Many diversified investors who own crypto keep it to a low single-digit share of the portfolio and rebalance with written rules.
Related articles
- Equal-Weight vs Cap-Weighted S&P 500: RSP vs SPY After October's Rotation and Nvidia's CEO ShockEqual weight vs cap weighted S&P 500: how RSP and SPY differ, why October 2026's rotation was the widest since 2009, and how to blend both after Nvidia's shock.
- Money Market Funds vs High-Yield Savings vs T-Bills: Where to Park Cash as the Fed HikesMoney market funds, high-yield savings or T-bills? Compare November 2026 yields, taxes, FDIC rules and liquidity as the Fed hikes, and build a smart cash plan.
- Homebuilder Stocks With Mortgage Rates Above 7%: An Investor's Guide for Late 2026Homebuilder stocks face 7% mortgage rates and a 16-year low in home sales. See what D.R. Horton, Lennar and Pulte earnings show and how to invest in 2026.
- 10 AI Trading Bots to Consider in 2026Discover the top 10 AI trading bots for 2026. Compare features, pricing, and AI capabilities of leading automated trading platforms including Alphio AI, Trade Ideas, Intellectia.ai, and more.
- 10 Best AI Crypto Trading Bots (August 2026)Discover the top 10 AI crypto trading bots for August 2026. Compare features, pricing, and performance of leading automated trading platforms including Alphio AI, Pionex, and more.
- S&P 500 Stock Market Outlook August 2026: Navigating Current Market ConditionsGet the latest S&P 500 market outlook for August 2026. Technical analysis, key stock picks, and expert forecast for SPY, NVDA, AAPL, and major sectors.