

Stock Market Sentiment Indicators: What Fear & Greed, AAII and Fund Managers Say Now
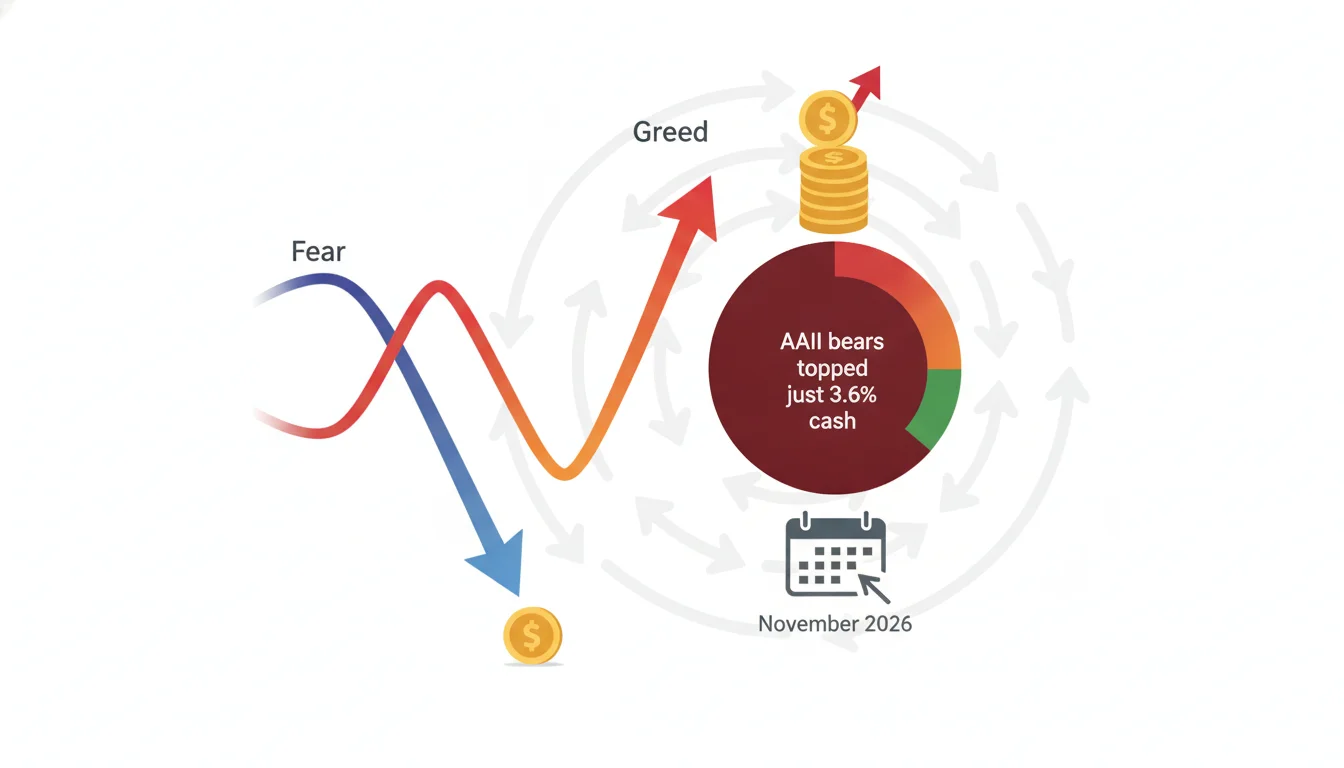
Fear & Greed hit 20 and AAII bears topped 51%, yet fund managers hold just 3.6% cash. Here's how to read stock market sentiment indicators in November 2026.

Key Takeaway
Fear has returned to Wall Street in a hurry. In the first three weeks of November 2026, the S&P 500 had its worst week since April 2025, CNN's Fear & Greed Index fell into "extreme fear," and bearish readings in the AAII Sentiment Survey rose above 50%. On Wednesday, November 18, the S&P 500 closed at 7,323.63, its fifth straight loss, a day after it posted its lowest close since July 29 (CNBC). For investors, the obvious question is whether all this gloom is a contrarian buy signal or a warning that the sell-off has further to run.
The honest answer is that stock market sentiment indicators work best as a dashboard, not a single trigger. Retail surveys, the Fear & Greed Index, and fund-flow data are flashing fear. Professional positioning tells a different story. Bank of America's November Global Fund Manager Survey put average cash at just 3.6%, which keeps BofA's contrarian "Cash Rule" on sell. Retail investors are scared, but institutions are still heavily invested, and that gap is the key to reading this market.
This guide explains how each major sentiment gauge is built, what the latest readings show as of mid-November 2026, why a hawkish Federal Reserve changes how contrarian signals behave, and how to build a simple, repeatable sentiment checklist so you aren't reacting to headlines. Nothing here predicts where the market goes next. The goal is a better process for deciding when fear is an opportunity and when it is information.
Why Stock Market Sentiment Indicators Matter After a Sell-Off
What sentiment actually measures
Sentiment indicators try to measure the mood and positioning of market participants rather than the fundamentals of the companies they own. Some are opinion polls, such as the AAII survey, which asks individual investors where they think stocks will be in six months. Others are built from market data, such as options volumes, volatility, and breadth, and infer emotion from behavior. A third group tracks money: fund flows, cash balances, and portfolio allocations. Each one answers a slightly different question, and confusing them is one of the most common mistakes investors make when they cite "sentiment" as a reason to buy or sell.
What people say and what they do often diverge. That is roughly what November 2026 looks like: loud pessimism in the polls, but institutional positioning that has barely moved off its highs.
The contrarian logic and its limits
The case for watching sentiment is contrarian. When almost everyone is fearful, many of the people likely to sell have already sold, and the pool of future buyers is larger. When almost everyone is euphoric, the opposite is true. AAII itself describes its survey as a contrarian indicator and notes that unusually high bearish readings have often been followed by above-average returns. That logic is sound in principle, but it has a serious weakness: extremes can persist. Fear can turn into deeper fear, and an "oversold" market can get far more oversold when a fundamental driver, such as rising interest rates, keeps getting worse.
That is why experienced strategists rarely act on a single reading. They look for extremes across several independent gauges, then wait for price to confirm that sellers are tiring. Sentiment tells you where the fuel is. It does not tell you when the spark arrives.
The November 2026 setup
The current bout of fear has clear catalysts. On Thursday, November 5, the S&P 500 fell 4.36%, the Nasdaq Composite dropped 5.52% to 24,315 and entered correction territory, and the Philadelphia Semiconductor Index plunged 12.25% in a single session, according to a BeInCrypto report republished by Mitrade. BTIG's Jonathan Krinsky, quoted by TheStreet, noted it was the first 80% downside day on the NYSE since December 2025. A hotter-than-expected October CPI followed on November 10, with core prices up 0.3% for a third straight month of upside surprises. Then the minutes of the Fed's October meeting, released November 18, showed that "almost all participants" judged further rate increases would likely be appropriate (CNBC).
The CNN Fear & Greed Index: A Composite Read on Market Emotion
The seven inputs behind the number
CNN's Fear & Greed Index condenses seven market-based indicators into a single score from 0 to 100. The inputs cover market momentum (the S&P 500 versus its 125-day moving average), stock price strength (new 52-week highs versus lows), stock price breadth (advancing versus declining volume), put and call options activity, junk bond demand (the spread between high-yield and investment-grade bonds), market volatility (the VIX relative to its average), and safe-haven demand (stock returns versus Treasury returns). Readings below 25 are labeled extreme fear, and readings above 75 are extreme greed.
Because it blends price action, options, credit, and volatility, the index reacts quickly, which also means it largely reflects what the market has already done.
What the November reading said
On the morning of Friday, November 6, the index sat at 20, firmly in extreme fear, according to the BeInCrypto/Mitrade report. It had read 26 a week earlier and a neutral 47 a month before. The VIX closed at 28.18 on November 5 after jumping roughly 70% in one day, which Barchart called one of the largest percentage gains in the index's history. By Tuesday, November 10, the VIX had cooled to 19.45, according to TheStreet, a reminder of how fast volatility-driven fear can unwind once forced selling stops.
How to use it without overreacting
The most useful way to read Fear & Greed is as a regime gauge. A single plunge into the teens after a sharp drop is common and often marks short-term exhaustion. A reading that stays below 25 for weeks while the market keeps grinding lower is a different situation, because it signals persistent selling pressure rather than a one-day flush. Investors who track the index should note how long it stays in a zone, not just the level, and check whether junk bond demand and safe-haven demand are improving, since credit stress tends to lead equities in genuine bear markets.
The AAII Investor Sentiment Survey: What Individual Investors Think
How the survey works
The American Association of Individual Investors has asked its members the same question every week since 1987: do you think stocks will be higher, unchanged, or lower over the next six months? Results run Thursday through Wednesday and are published on Thursdays. The long-run historical averages are 37.5% bullish, 31.0% neutral, and 31.5% bearish, and the bull-bear spread averages about +6.5 percentage points. AAII notes that a spread below -10 has historically been considered notably pessimistic.
The latest numbers
For the week ending November 11, 2026, AAII reported 30.8% bullish, 17.8% neutral, and 51.4% bearish, a bull-bear spread of -20.6 points. A week earlier, bearish sentiment had jumped 6.9 points to 48.4% while bullish sentiment fell to 34.1%. AAII noted at the time that bearish sentiment had been above its historical average for 39 consecutive weeks. For context, the 2026 bearish high was 53.3% in the week ending September 16, and the all-time record of 70.3% came on March 5, 2009, near the bottom of the financial crisis.
The November 4 survey also carried a special question about monetary policy. When AAII members were asked about the Fed's decision to hold rates steady, 55.5% called it the right move and 30.7% said the Fed should have raised rates. Only 6.6% wanted a cut. Even individual investors, in other words, have accepted a higher-for-longer rate backdrop.
Read streaks, not single weeks
A bearish reading above 50% is striking, but the more telling detail is the streak. When pessimism stays above average for most of a year, the survey reflects a chronic unease rather than acute panic. That kind of grinding skepticism can actually support a market, because investors who are already wary are less likely to be shaken out. The more powerful contrarian setups have historically come when a long stretch of bearishness coincides with extreme readings in other, independent gauges, which is why AAII should be one input rather than the whole case.
Professional Positioning: The BofA Global Fund Manager Survey
The Cash Rule and why it still says sell
Bank of America's monthly Global Fund Manager Survey is the most widely watched gauge of institutional positioning. The November edition, conducted November 6 to 12 among 169 participants managing about $461 billion, showed average cash balances falling to 3.6% of assets from 3.9% in October, the lowest since August, according to a summary published by Atrani Capital. Under BofA's contrarian Cash Rule, cash at or below 4.0% is treated as a sell signal, because it implies managers have little dry powder left to buy dips.
That is the striking contrast of this sell-off. Retail investors are telling AAII they are bearish, and the Fear & Greed Index is at panic levels, but professional money managers have not raised cash. Equities remain the largest overweight in the survey, at a net 41%.
A historic cut to tech
What managers did change was their mix. The net overweight in technology collapsed to 12% from 37% in October, the biggest one-month cut since June 2006. "Long global semiconductors" was still named the most crowded trade by 39% of respondents, down from a record 82% in July. An AI bubble was cited as the biggest tail risk by 34%, while a hyperscaler credit event jumped to 31% from 11%. A net 52% now expect AI hyperscalers to cut capital spending within six months.
Why Hartnett is not yet buying
BofA's chief investment strategist Michael Hartnett has argued that the best entry points have historically come after fund managers cut tech all the way to underweight, according to coverage of the survey. At a net 12% overweight, positioning has not reached that point. BofA's Bull & Bear Indicator fell to 7.4 from 8.1, moving below its 8.0 sell trigger but still well above the low readings that typically mark buy signals. The message from the institutional side is that sentiment has cooled, but capitulation hasn't happened.
Smart Money vs. Retail: Fund Flows and Advisor Surveys
BofA client flows reveal a split
Flow data shows the split in real money. In the week ending around November 6, Bank of America's institutional clients bought a net $6.1 billion of U.S. stocks, while hedge funds added $0.8 billion, their first net buying in four weeks, according to TheStreet's summary of BofA data. Across all clients, equity ETFs took in $5.3 billion, the fourth-largest weekly inflow in BofA's records. Retail clients, by contrast, sold a net $2.1 billion and have been net sellers for four straight weeks. RBC Capital Markets' Amy Wu Silverman told CNBC that the November 5 rout "was kicked off by a lot of retail put buying."
Investors Intelligence and the newsletter crowd
The Investors Intelligence survey, which tracks the views of independent newsletter writers, showed bulls falling to 37% and bears rising to 24% in the week of November 11, the most bears and fewest bulls since April, as TheStreet's Helene Meisler noted. Newsletter writers tend to follow trends, so a sharp drop in their bullishness after a decline is common. It becomes meaningful as a contrarian signal when bears outnumber bulls outright, a threshold the survey hasn't yet crossed.
NAAIM, put-call ratios, and other positioning tools
Two other gauges round out a positioning picture. The NAAIM Exposure Index asks active money managers how much equity exposure they hold each week, which turns opinion into actual allocation. The Cboe equity put-call ratio measures how many bearish options contracts trade relative to bullish ones, and spikes in put buying often line up with short-term lows because they reflect hedging demand at peak anxiety. Neither is perfect alone. The value lies in seeing whether these behavioral measures agree with the surveys or contradict them.
Why Fear Can Stay Fearful: The Fed Changes the Math
A hawkish Fed weakens contrarian signals
Contrarian sentiment signals have their best record when the Fed is easing or about to ease, because cheaper money gives investors a reason to step back in once panic subsides. November 2026 is the opposite setup. The federal funds range stands at 3.75% to 4.00%, and Governor Christopher Waller told CNBC on November 18 that a half-point increase is "probably necessary" at the December 8-9 meeting. Goldman Sachs, as reported by TheStreet, expects a quarter-point hike in December and another in March 2027, with the first cut not until late 2027. Those are projections, not certainties, but they describe a market where the cost of capital is rising while sentiment is falling.
The 2022 lesson
The best recent example of fear failing as a buy signal is 2022. AAII bearishness and extreme-fear readings appeared repeatedly that year, yet the S&P 500 kept making lower lows as the Fed raised rates aggressively. The BeInCrypto analysis republished by Mitrade made the same point about the Nasdaq: the index traded higher six months after nine of its last ten corrections, and the exception was 2022, when the Fed kept tightening. History doesn't repeat neatly, but it does show that sentiment extremes fight the Fed at their peril.
What would confirm a durable low
Because the Fed is the swing factor, investors should look for confirmation beyond sentiment. Useful signs would include credit spreads stabilizing rather than widening, breadth improving with more stocks above their 50-day averages, the VIX settling back below 20 and staying there, and fund managers finally raising cash or cutting tech to underweight. A cooler November CPI, due December 10, would also help. Absent those signals, fear may be a description of conditions rather than a forecast of a rebound.
How to Build Your Own Sentiment Dashboard
Pick a small set of independent gauges
The most useful dashboards are small and diverse. Five gauges, each measuring something different, give you more signal than twenty that all reflect the same price action. A balanced starter set looks like this:
- CNN Fear & Greed Index, for a fast composite of market-based emotion
- AAII bull-bear spread, for retail opinion and the length of bearish streaks
- BofA Fund Manager Survey cash level and tech allocation, for institutional positioning
- Cboe equity put-call ratio, for real-time hedging demand
- High-yield credit spreads, for a check on whether fear is spreading into credit
Pair sentiment with price and breadth
Sentiment should never be read in isolation from price. A useful discipline is to require two conditions before treating fear as an opportunity: several gauges at extremes, and a price signal such as the S&P 500 reclaiming a key moving average or a broad-based up day where most NYSE volume is advancing. That combination filters out the many occasions when markets are fearful and still falling.
Automate the routine
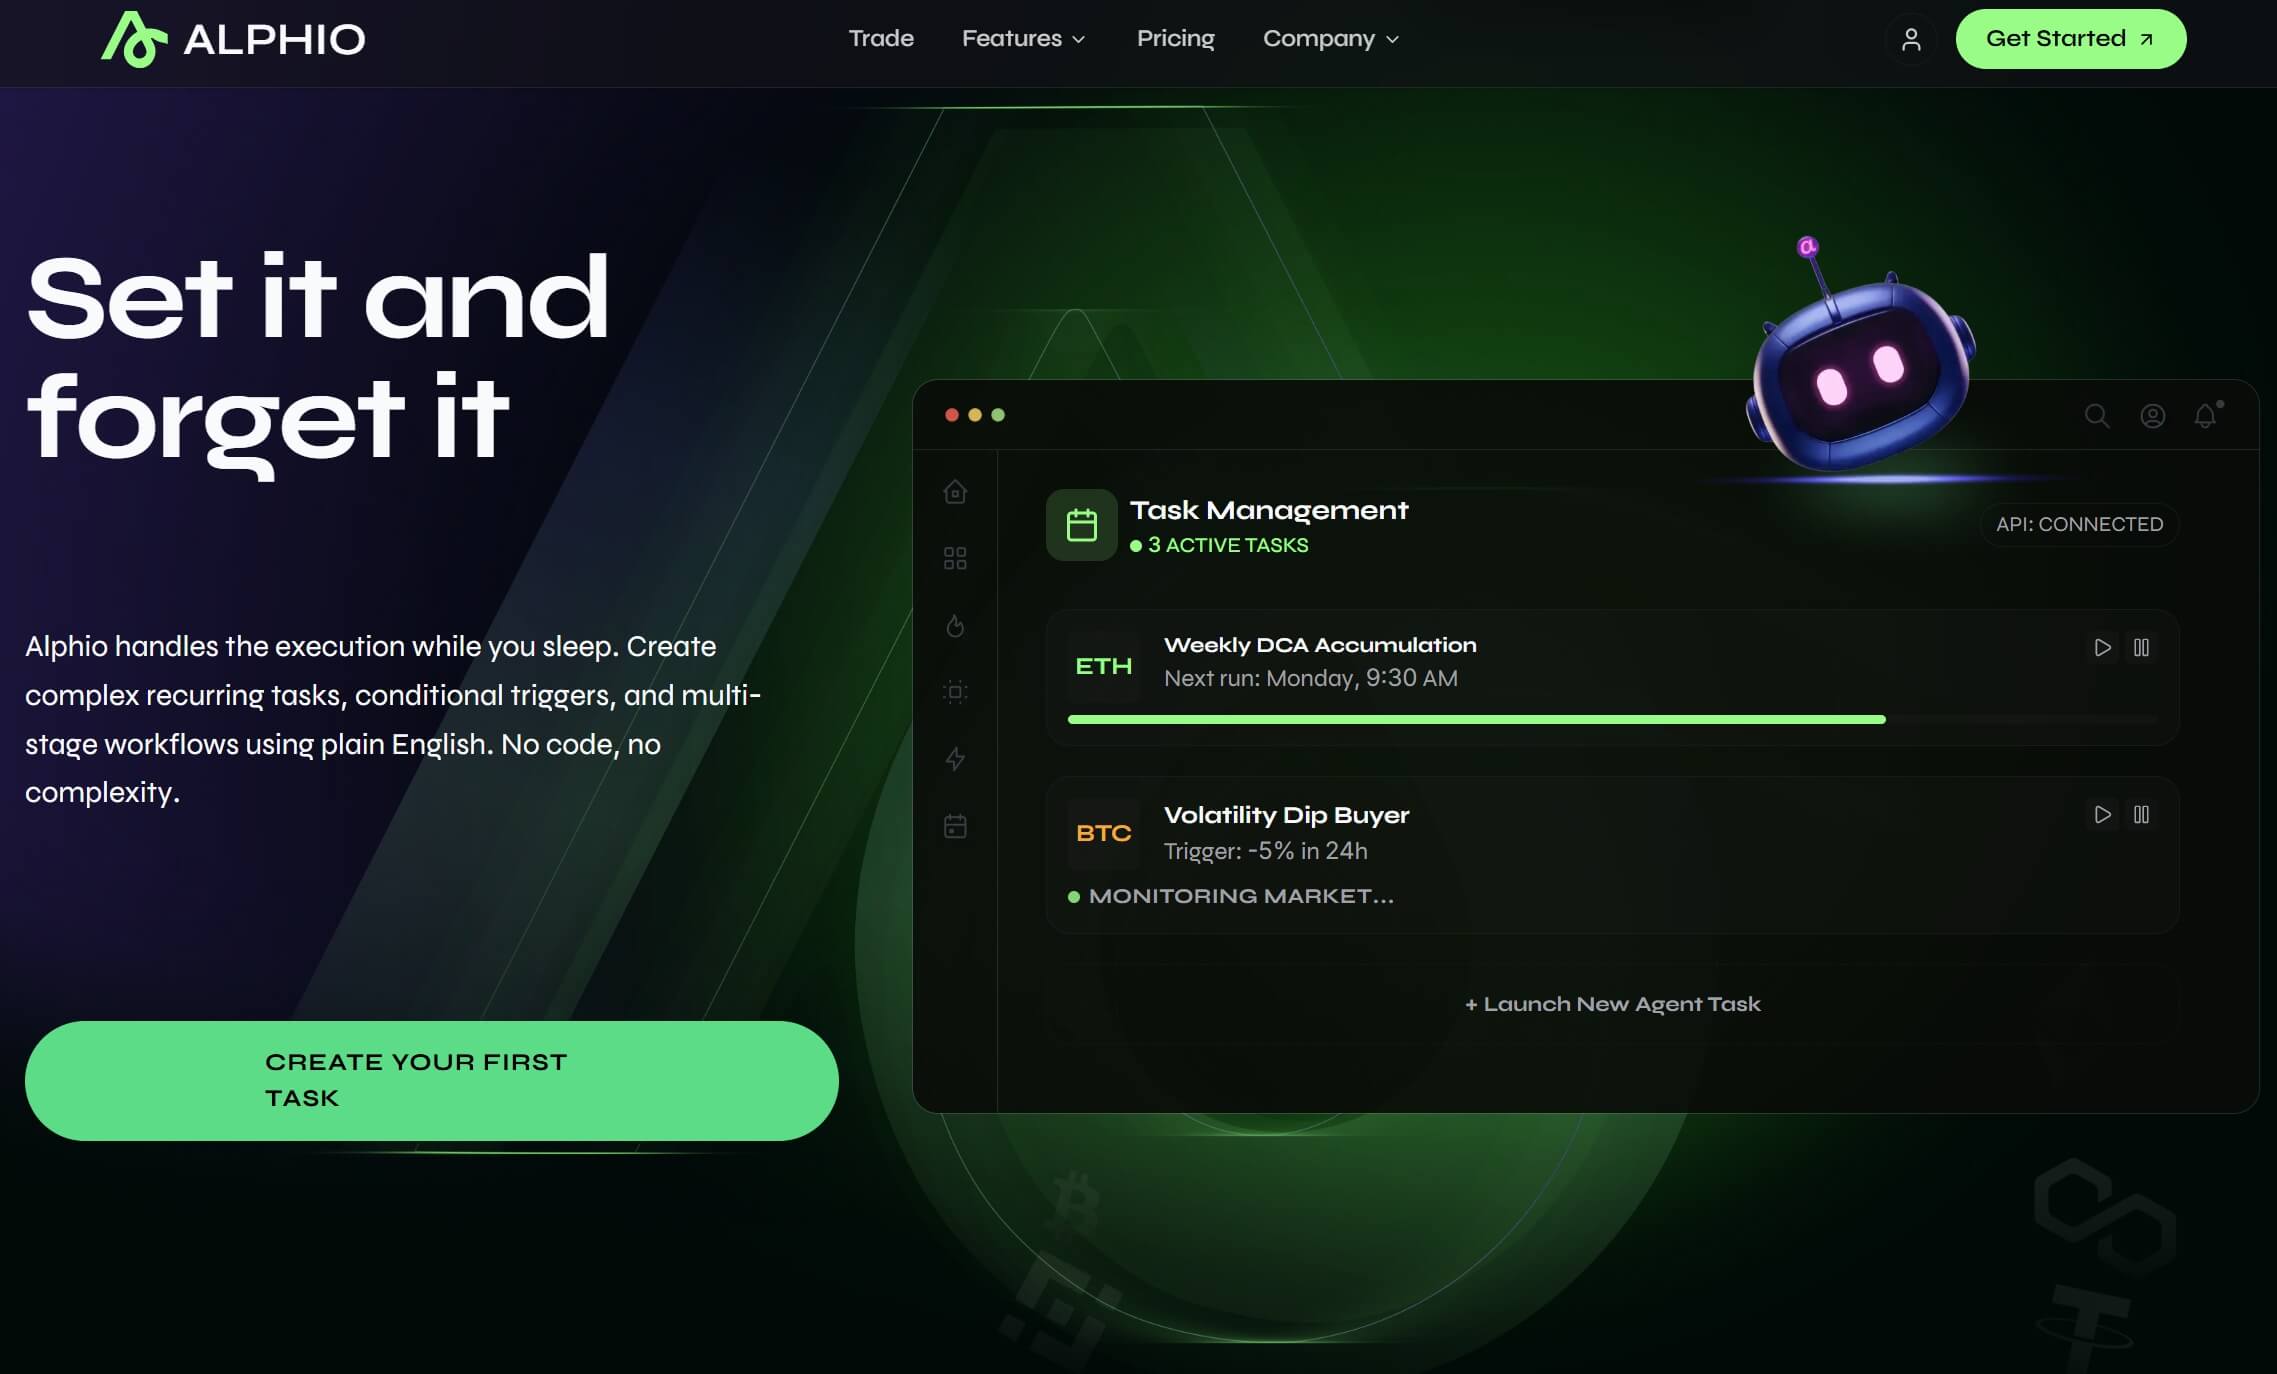
The hardest part of sentiment work is consistency. Most investors check the Fear & Greed Index only after a bad day, which guarantees they see fear at its loudest. Setting a fixed weekly review, for example every Thursday after AAII publishes, removes that bias. Tools such as Alphio's Scheduled Task feature can run a recurring check on the gauges and price levels you care about and send you the results on a set schedule, so the routine happens even on busy weeks.
Turning Sentiment Into Portfolio Decisions
Use sentiment to size and stage, not to time
Sentiment is most valuable for adjusting how much and how fast, rather than whether to invest at all. An investor with a long horizon might stage new purchases in thirds when fear readings are extreme, adding the first tranche on the signal and the rest only if price confirms. That approach captures part of the upside if the low is in, while limiting regret if the sell-off deepens. Conversely, when euphoria readings stack up, trimming winners back to target weights is often a better response than abandoning the market.
Ask better questions during volatile weeks
Volatile weeks produce a flood of headlines and very little clarity. Before acting, it helps to ask concrete questions: how far is the index from its recent high, how did similar sentiment readings play out in past Fed tightening cycles, and how concentrated is my portfolio in the most crowded trades? Alphio's Conversational Trading lets you ask those kinds of questions in plain language and review the answers before deciding on any trade, which keeps the analysis ahead of the emotion.
Common mistakes to avoid
The most common error is treating one extreme reading as a guarantee. Another is mixing up opinion and positioning, as the gap between AAII and the BofA survey shows. A third is ignoring the macro regime when the Fed is tightening. Writing your plan down before volatility hits is the simplest defense.
Conclusion
November 2026 offers a textbook lesson in reading stock market sentiment indicators. The retail and market-based gauges are flashing fear: CNN's Fear & Greed Index hit 20, AAII bears topped 51%, and retail investors have sold for four straight weeks. Yet the professional side has not capitulated. Fund managers hold just 3.6% cash, still overweight equities, and the Fed is signaling more rate hikes. That combination argues for patience and process rather than a reflexive buy-the-dip trade, and for watching whether institutions finally raise cash or cut tech to underweight.
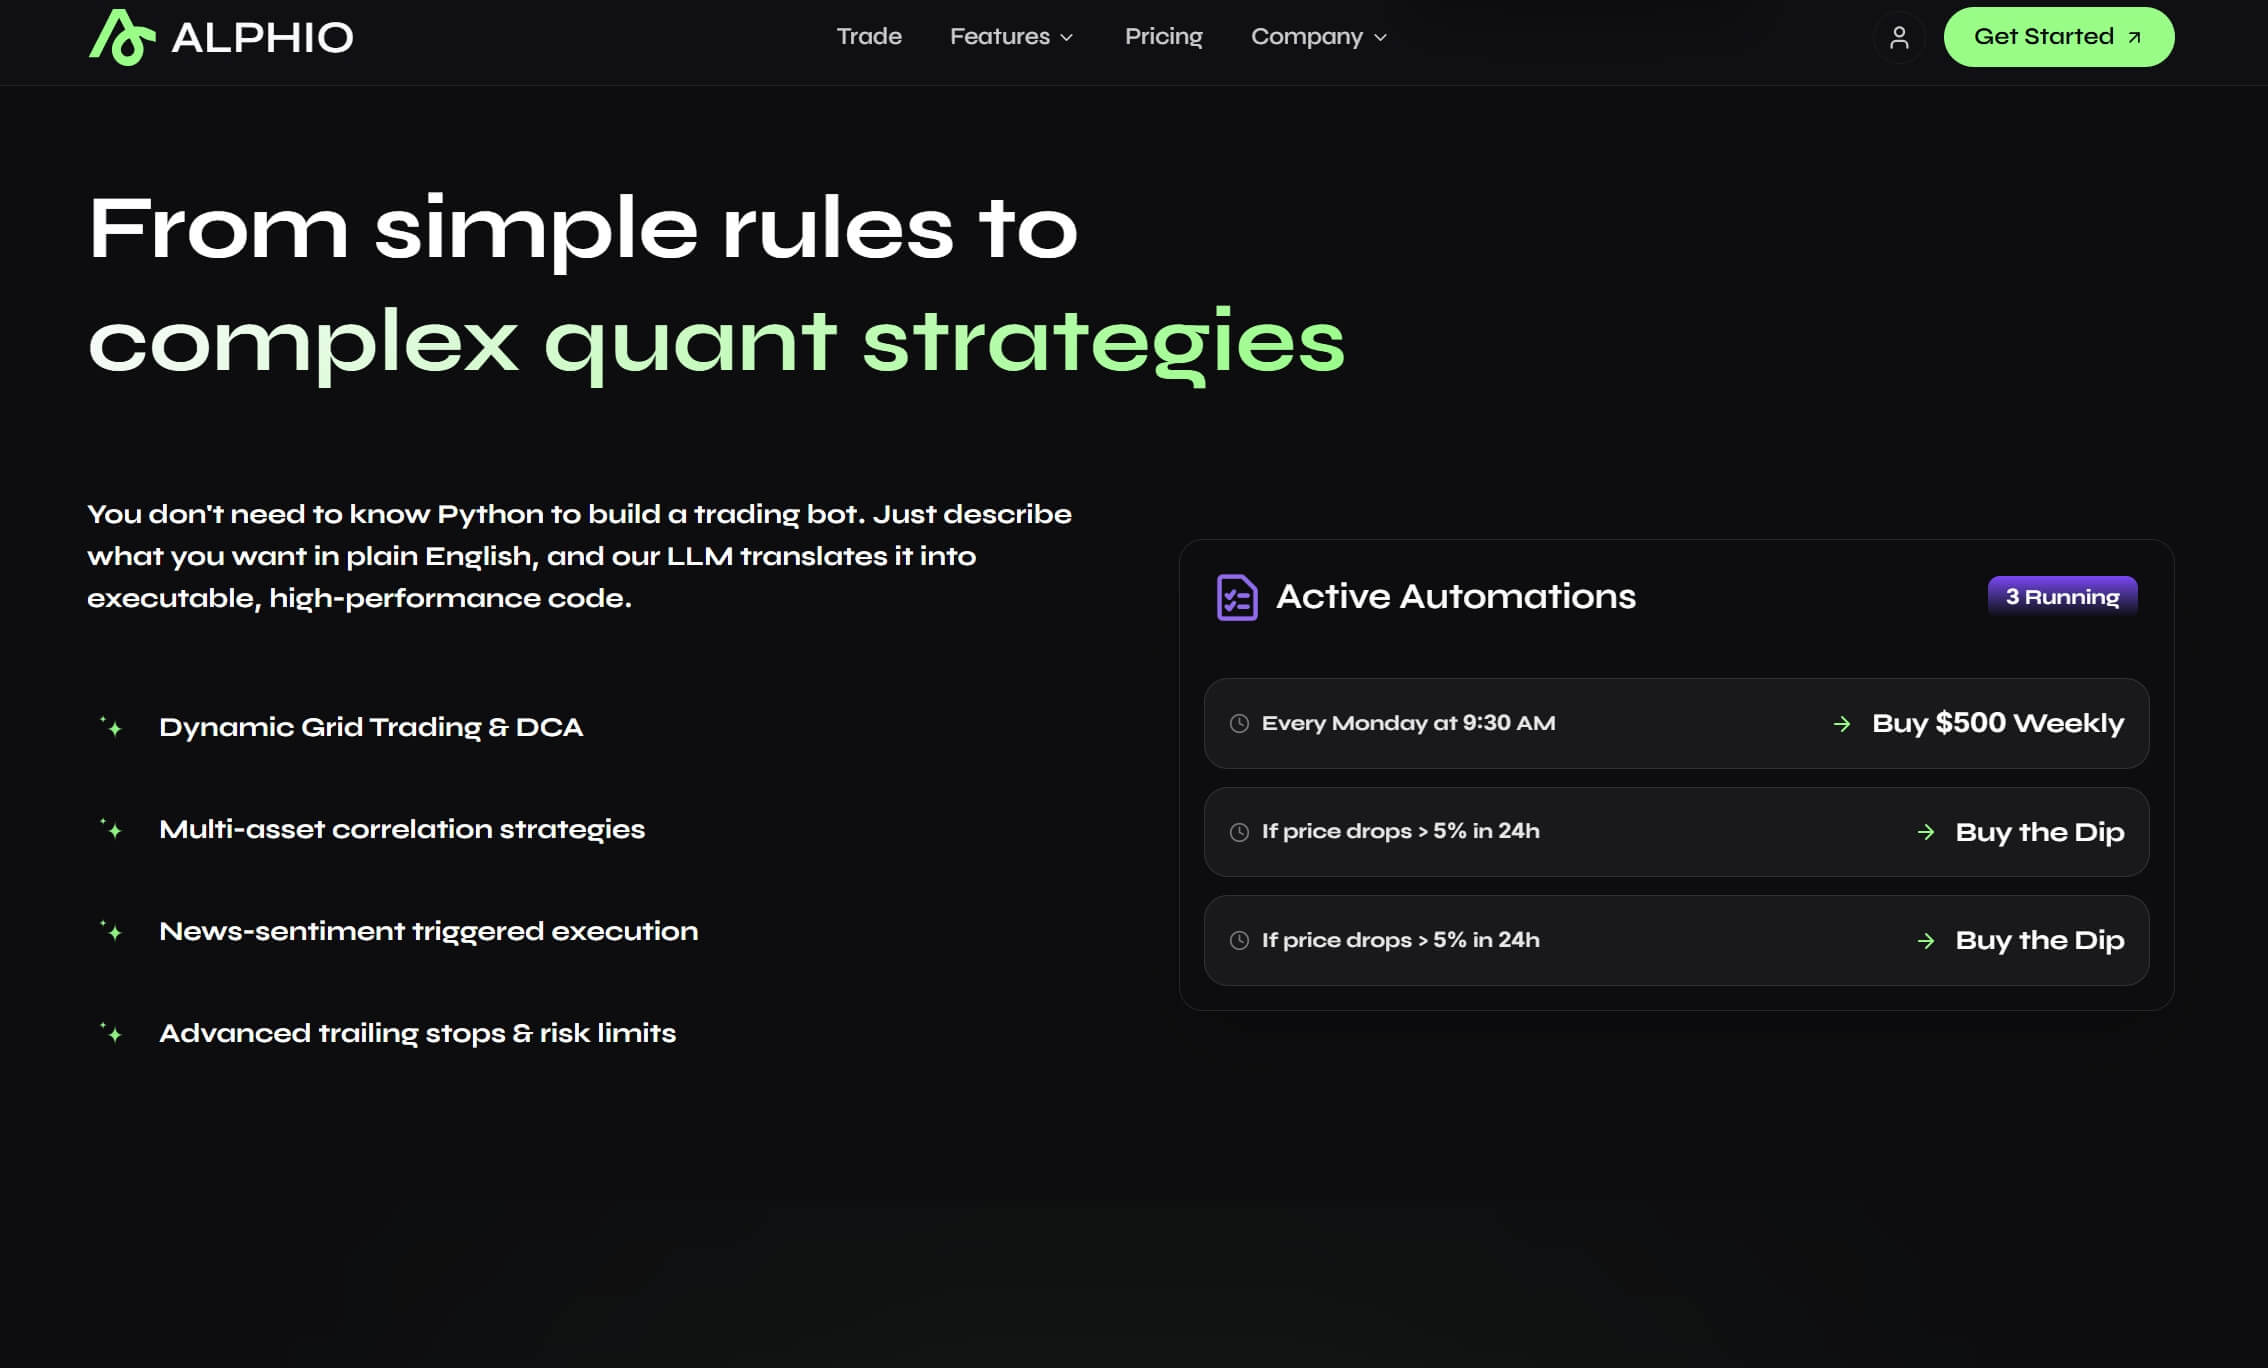
The practical takeaway is to build a small, diverse dashboard, review it on a fixed schedule, and require price confirmation before you treat fear as an opportunity. For investors who want to see how experienced traders are positioning through the volatility, Alphio's Copy Trade feature lets you follow strategies with transparent track records. Those who prefer rules-based execution can explore Autonomous Trading, which can carry out a plan you define, including staged entries and risk limits, without the emotional whiplash that sentiment extremes create. Neither tool removes market risk, but both can help you stick to a plan when the crowd is panicking.
FAQs
What are stock market sentiment indicators?
Stock market sentiment indicators measure the mood and positioning of investors rather than company fundamentals. They include surveys like the AAII Sentiment Survey, market-based composites like the CNN Fear & Greed Index, and positioning data such as fund manager cash levels and fund flows.
Is extreme fear a good time to buy stocks?
Extreme fear has often preceded above-average returns, but it is not a reliable buy signal on its own. In 2022, fear readings appeared repeatedly while the Fed kept hiking and stocks kept falling, so many investors wait for price and breadth to confirm before adding exposure.
What does the AAII bull-bear spread tell investors?
The bull-bear spread is the percentage of bullish AAII respondents minus the percentage of bearish ones, with a long-run average of about +6.5 points. A spread below -10 is historically considered notably pessimistic; it was -20.6 for the week ending November 11, 2026.
What is the BofA Cash Rule?
The Cash Rule is a contrarian signal from Bank of America's Global Fund Manager Survey. Cash at or below 4.0% is treated as a sell signal because managers have little dry powder, while cash well above that level suggests fear is high enough to support buying; November 2026 cash was 3.6%.
How often should I check sentiment indicators?
A fixed weekly review works well for most long-term investors, for example after AAII publishes its survey on Thursdays. Checking only after big down days biases you toward seeing fear at its loudest, so a consistent schedule produces better decisions.
Related articles
- Leveraged ETFs in the 2026 Sell-Off: Why TQQQ and SOXL Dip Buyers Got Crushed by Volatility DecayLeveraged ETFs like TQQQ and SOXL fell hard in the 2026 sell-off. Learn how daily resets and volatility decay work, and how to size and time-box 3x trades.
- Dividend Stocks vs 5% Treasury Yields: How Income Investors Should Adapt in 2026With 10-year Treasury yields above 5% and the S&P 500 yielding about 1.1%, here is how to judge dividend stocks, avoid yield traps, and build income in 2026.
- Roth Conversion in a Down Market: How to Use the 2026 Sell-Off Before December 31Stocks fell 8% from their high. Learn how a Roth conversion in a down market works, how to size it with 2026 tax brackets, and the traps to avoid by Dec 31.
- Stripe's 3 Billion PayPal Takeover Bid: The Largest Fintech Acquisition in HistoryStripe and Advent's 3 billion bid for PayPal signals a historic fintech consolidation. Explore the strategic implications, antitrust concerns, and what this means for investors.
- Gold Investment Strategy 2026: How to Protect Your Portfolio as US Debt Nears 40 TrillionDiscover the best gold investment strategies for 2026. Learn how to hedge against inflation and economic uncertainty with physical gold, ETFs, and mining stocks.
- How to Build Passive Dividend Income: A Complete Strategy Guide for 2026Learn how to build sustainable passive dividend income with proven strategies, stock picks, and portfolio allocation. Expert guide to dividend investing in 2026.