
樂
樂觀
樂觀 · 25%PG
$202.75
情境價格
$153.040
-0.153 (-0.10%)收盤時
The Procter & Gamble Company is focused on providing branded consumer packaged goods to consumers across the world. The Company’s segments include Beauty, Grooming, Health Care, Fabric & Home Care and Baby, Feminine & Family Care. The Company’s products are sold in approximately 180 countries and territories primarily through mass merchandisers, e-commerce, including social commerce channels, grocery stores, membership club stores, drug stores, department stores, distributors, wholesalers, specialty beauty stores, including airport duty-free stores), high-frequency stores, pharmacies, electronics stores and professional channels. It also sells direct to individual consumers. It has operations in approximately 70 countries. It offers products under brands, such as Head & Shoulders, Herbal Essences, Pantene, Rejoice, Olay, Old Spice, Safeguard, Secret, SK-II, Braun, Gillette, Venus, Crest, Oral-B, Ariel, Downy, Gain, Tide, Always, Always Discreet, Tampax, Bounty and others.
Procter & Gamble is a good buy right now due to its current price of $151.23, which is below the average analyst price target of $166, suggesting potential upside. Additionally, the stock has shown a strong 5-day change of +4.36% and a solid gross margin of 51.81% in the latest quarter, indicating healthy profitability. The main risk is the insider selling activity, which has increased by 182.61% over the last month, signaling potential concerns among insiders about the stock's future performance.
BofA
$170
2026-10-09
BofA
2026-10-09
目標價
$170
RBC Capital
$166
2026-10-06
RBC Capital
2026-10-06
目標價
$166
Evercore ISI
$166
2026-10-06
Evercore ISI
2026-10-06
目標價
$166
Argus
—
2026-08-07
Argus
2026-08-07
目標價
—
Deutsche Bank
$162
2026-07-30
Deutsche Bank
2026-07-30
目標價
$162
情境價格取自當年最後一個月度預測區間。機率為固定的模型權重(25 / 50 / 25),不構成保證。

P&G Announces Dividend and Board Elections at 2026 Annual Meeting
Investors Increase Margin Debt, Signaling Caution Ahead
Charmin Launches New Ultra Strong with Wider Sheets

Market Warning: High Valuations and Defensive Investments

Procter & Gamble: The Preferred Choice for Steady Investment
The Procter & Gamble Company is focused on providing branded consumer packaged goods to consumers across the world. The Company’s segments include Beauty, Grooming, Health Care, Fabric & Home Care and Baby, Feminine & Family Care. The Company’s products are sold in approximately 180 countries and territories primarily through mass merchandisers, e-commerce, including social commerce channels, grocery stores, membership club stores, drug stores, department stores, distributors, wholesalers, specialty beauty stores, including airport duty-free stores), high-frequency stores, pharmacies, electronics stores and professional channels. It also sells direct to individual consumers. It has operations in approximately 70 countries. It offers products under brands, such as Head & Shoulders, Herbal Essences, Pantene, Rejoice, Olay, Old Spice, Safeguard, Secret, SK-II, Braun, Gillette, Venus, Crest, Oral-B, Ariel, Downy, Gain, Tide, Always, Always Discreet, Tampax, Bounty and others. It operates in the Consumer Non-Cyclicals sector (SOAP, DETERGENTS, CLEANG PREPARATIONS, PERFUMES, C industry).
Procter & Gamble is a good buy right now due to its current price of $151.23, which is below the average analyst price target of $166, suggesting potential upside. Additionally, the stock has shown a strong 5-day change of +4.36% and a solid gross margin of 51.81% in the latest quarter, indicating healthy profitability. The main risk is the insider selling activity, which has increased by 182.61% over the last month, signaling potential concerns among insiders about the stock's future performance.
22 analysts cover PG: 10 rate it Buy, 10 Hold and 2 Sell. The average price target is 164.50.

$PG is a good defensive name with a solid setup to add to your watchlist. Price is just about to break out of a huge symmetrical triangle on the weekly chart here 📈 Earnings on the morning of Oct. 22nd (+/-5.18% implied move)
展開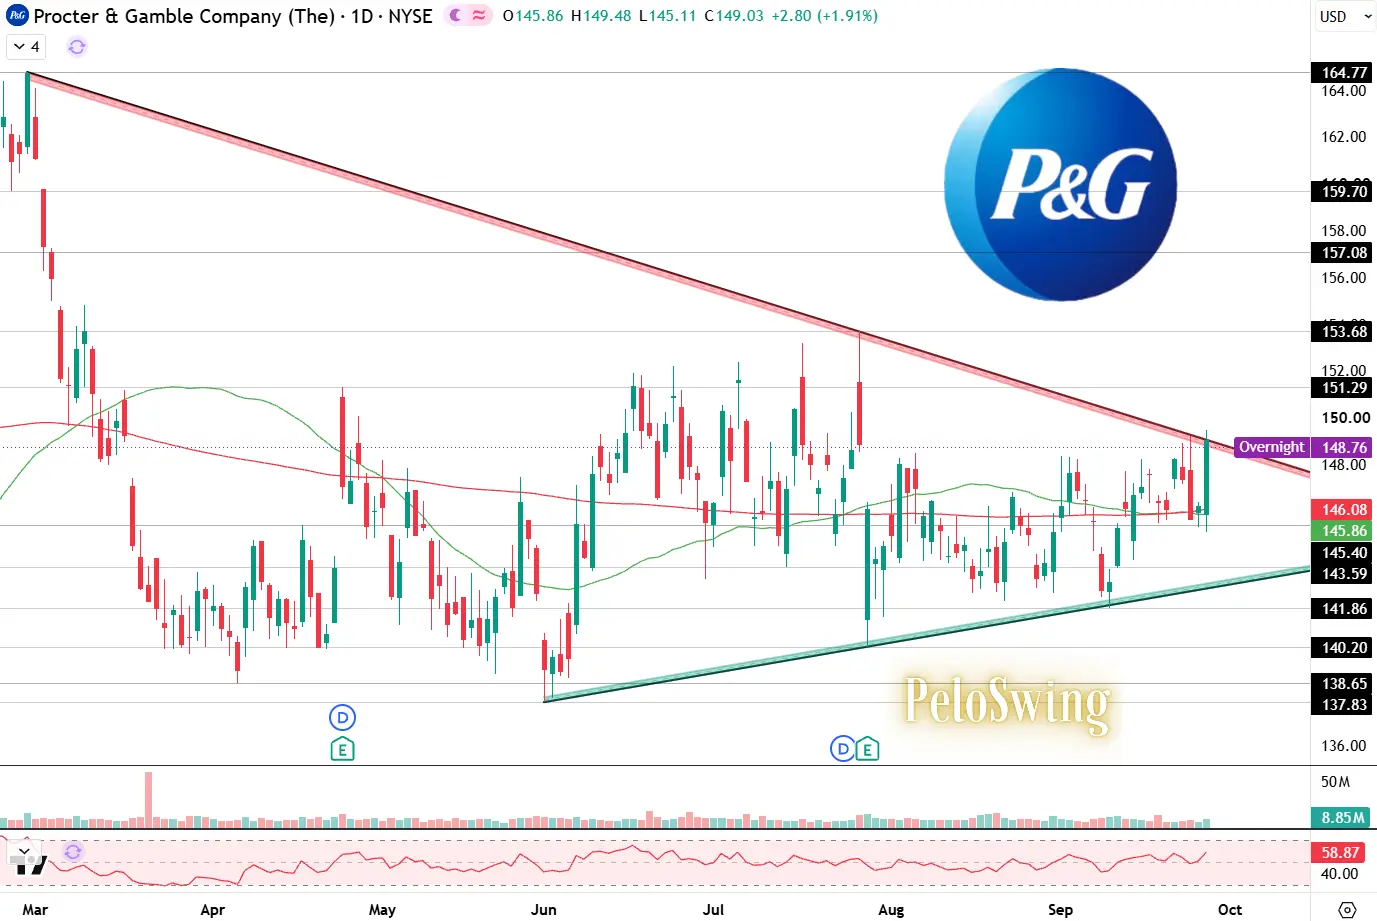

$PG According to FAST Graphs, over the past decade, a valuation of around 20x has often marked the stock’s bottom, including during the pandemic. FAST Graphs is exceptional for visualizing fundamental trends. Instead of digging through endless tables, you get a clean, evidence-based picture of valuation, earnings, and long-term performance.
展開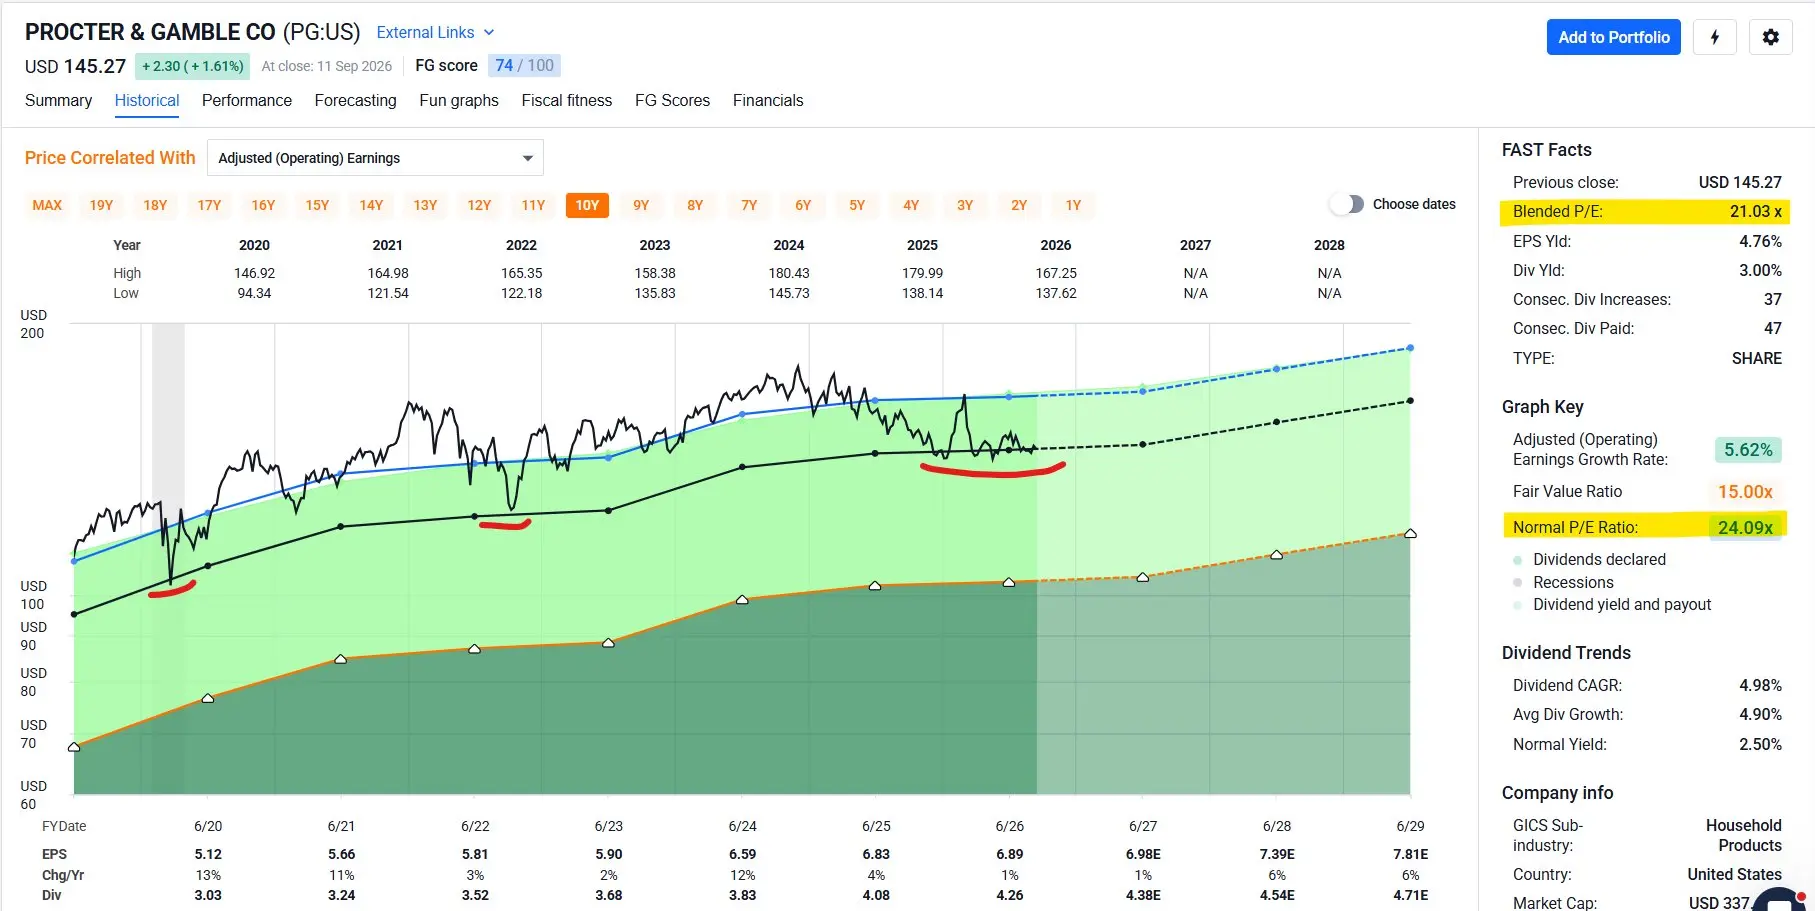
本頁僅供研究參考,不構成投資建議。模型可能出錯。過往表現不代表未來結果。