
乐
乐观
乐观 · 25%OGN
$9.72
情景价格
$13.750
0.000 (0.00%)收盘时
Organon & Co. is a global healthcare company. The Company is engaged in developing and delivering health solutions through a portfolio of prescription therapies and medical devices within women's health, biosimilars and a franchise of established medicines across a range of therapeutic areas. It has a portfolio of approximately 70 medicines and products across a range of therapeutic areas. It has a portfolio of contraception and fertility brands, including Nexplanon, NuvaRing, and Follistim AQ. Its Biosimilars portfolio spans across immunology and oncology treatments. It also has a portfolio of established brands, including brands in cardiovascular, dermatology and non-opioid pain management. It sells these products through various channels, including drug wholesalers and retailers, hospitals, government agencies and managed health care providers, such as pharmacy benefit managers and other institutions.
Organon & Co appears to be a good buy right now due to its current price of $13.76, which is below the analyst price target of $14, suggesting a potential upside of 1.75%. Additionally, the forward P/E ratio of 5.09 indicates that the stock is undervalued compared to its earnings potential. The recent approval of the drug NDUVRA for atopic dermatitis may also drive future revenue growth, addressing a significant market need.
情景价格取自当年最后一个月度预测区间。概率为固定的模型权重(25 / 50 / 25),不构成保证。

Organon to Release Q3 2026 Financial Results
MIUDELLA Phase 3 Study Results Show Long-Term Efficacy

Organon Canada Approves NDUVRA for Atopic Dermatitis

Organon Seeks FDA Approval for Extended Use of MIUDELLA IUD
Sebela Seeks FDA Approval to Extend MIUDELLA Use Duration to 6 Years
Organon & Co. is a global healthcare company. The Company is engaged in developing and delivering health solutions through a portfolio of prescription therapies and medical devices within women's health, biosimilars and a franchise of established medicines across a range of therapeutic areas. It has a portfolio of approximately 70 medicines and products across a range of therapeutic areas. It has a portfolio of contraception and fertility brands, including Nexplanon, NuvaRing, and Follistim AQ. Its Biosimilars portfolio spans across immunology and oncology treatments. It also has a portfolio of established brands, including brands in cardiovascular, dermatology and non-opioid pain management. It sells these products through various channels, including drug wholesalers and retailers, hospitals, government agencies and managed health care providers, such as pharmacy benefit managers and other institutions. It operates in the Healthcare sector (PHARMACEUTICAL PREPARATIONS industry).
Organon & Co appears to be a good buy right now due to its current price of $13.76, which is below the analyst price target of $14, suggesting a potential upside of 1.75%. Additionally, the forward P/E ratio of 5.09 indicates that the stock is undervalued compared to its earnings potential. The recent approval of the drug NDUVRA for atopic dermatitis may also drive future revenue growth, addressing a significant market need.
$OGN #OGN Breaking out of a bullish pennant on the 4H chart. A decisive breakout could bring a 50-55% upside move.
展开
🔥 $OGN After facing resistance near the $0.0500 zone, it continues to show bearish momentum. Price keeps forming lower highs and lower lows, gradually declining toward the $0.0300 support area. If selling pressure persists and support fails, OGN may pull back further to lower levels. 📉 Take profit: 0.010556 Stop loss: 0.03747 Short $OGN 👇
展开

One thing I've come to appreciate about trading is that having money to invest is not enough; you also need the right knowledge, mindset, and someone who can help you understand what you're doing. That's one reason I have so much respect for Craig. What stands out to me about Craig is his emphasis on understanding market movements rather than blindly following trends or jumping into every opportunity. His approach reminds me that real progress in trading comes from learning to manage risk, control emotions, and make decisions with a clear head. I believe more traders need to focus on building these skills instead of constantly searching for shortcuts. If you're serious about improving your trading knowledge, I'd suggest taking the time to study Craig's approach and see whether it fits your goals. For me, the value is in learning to think more carefully about every trade, not just chasing the next profit. $US $MHA $OGN
展开
The most unusual detail in today's market: the Fear & Greed Index reads 57, in greed territory, yet two of the three candidates on the 24h gainers list are falling — $OSMO dropped 15.75%, $OGN fell 7.65%, while only $ATOM bucked the trend with a 2.67% gain. This combination of "greed sentiment + intra-sector divergence" typically means capital is narrowing its front and concentrating into relatively stronger names rather than launching a broad offensive. From the broader market linkage perspective, greed sentiment has not yet turned extreme, and BTC shows no systemic risk signals, which is neutral-to-slightly-positive for $ATOM. But sector rotation is clear: OSMO and OGN have both broken below MA20 with MACD turning bearish, indicating that capital within the Cosmos ecosystem is moving toward the leader $ATOM. On the technical side, $ATOM at 1.886 has climbed above MA5 (1.8616) and MA20 (1.8266), with bullish MA alignment, RSI at 62.3 in strong territory but not overbought, MACD histogram at +0.01052 extending bullish momentum, and price hugging the upper Bollinger Band at 1.88017 — this is strong consolidation rather than a spike-and-fade. The only caution: funding rate at +0.0099% suggests longs are slightly crowded, with a possible short-term pullback. Directional bias is bullish; a pullback that holds MA5 is an opportunity. Entry reference 1.855–1.870 (MA5 support converging with the round number); TP1 at 1.920 (extension above the upper Bollinger Band, corresponding to prior high resistance); TP2 at 1.975 (measured-move extended target); stop loss at 1.815 (a break below MA20 invalidates the bullish structure). Also watch: $OSMO and $OGN are notably weaker relative to $ATOM — the former breaking down and the latter grinding lower without stabilization — not ideal for contrarian entries at this time. (Personal view, for reference only, not investment advice. Futures risk is extremely high; please strictly control position size.) [Data] Pair: ATOMUSDT Direction: Long Entry: 1.855-1.870 TP1: 1.920 TP2: 1.975 Stop Loss: 1.815
展开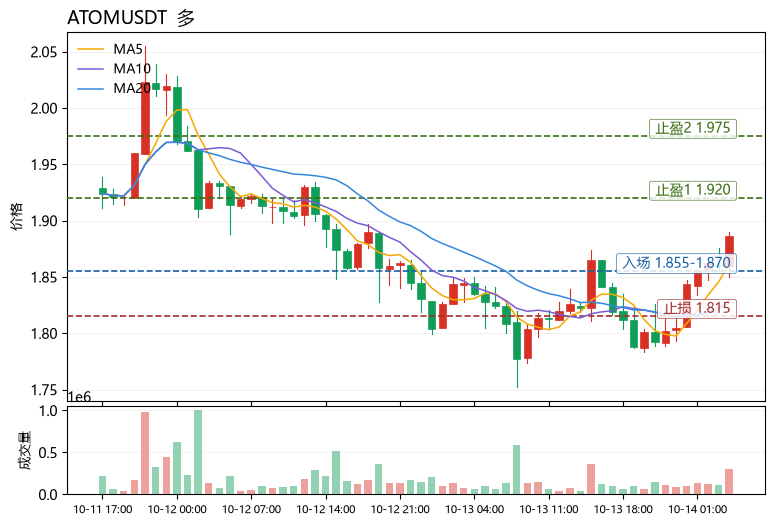

$OGN's two charts are giving opposite answers: the short term has already turned, while the larger cycle refuses to acknowledge it. This time, let's skip the gainers and losers lists and look only at position. The current price is 0.03504, about 5.14% from the 1-hour support at 0.03324, and about 25.00% from resistance at 0.0438. My condition is simple: only a breakout above 0.0438 that continues counts as upward follow-through; if it falls below 0.03324, the original view is invalidated. The 1-hour is weak, the 4-hour is strong, with RSI at 54 and 52 respectively. What is being debated now is not a directional slogan, but whether price can quickly reclaim 0.03324 after breaking below it. Is the short cycle signaling early, or just creating one fake move? The above is market observation and does not constitute investment advice. This is Niu Niu Shuo in the crypto space.
展开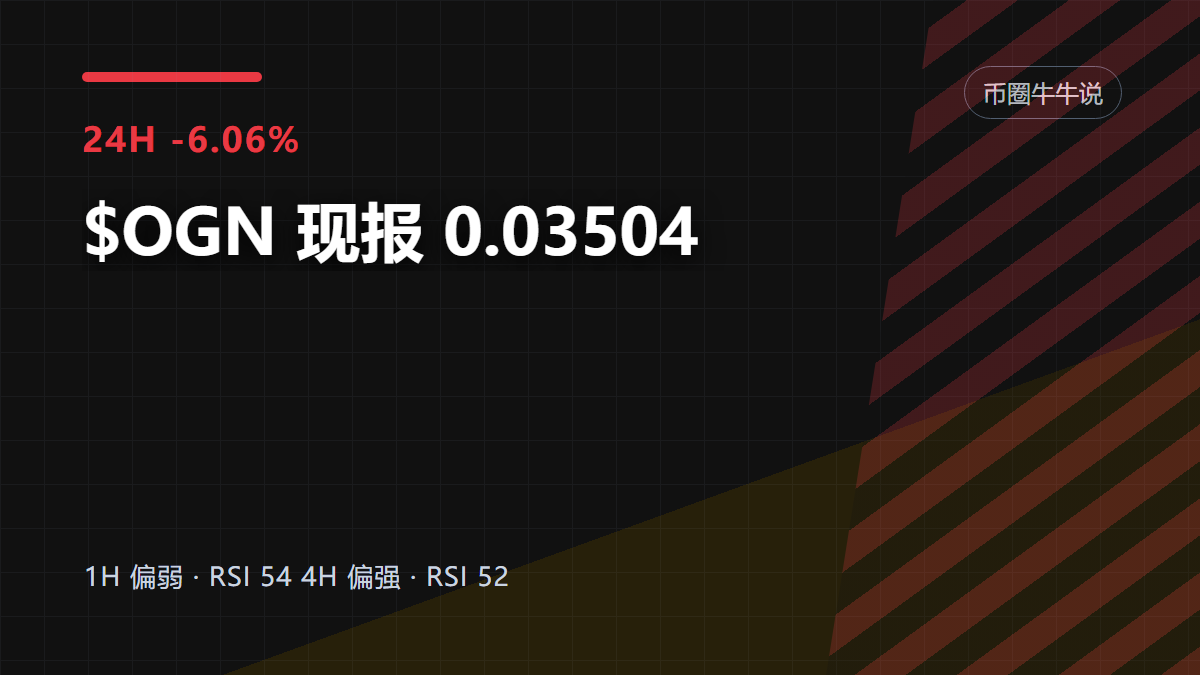
本页仅供研究参考,不构成投资建议。模型可能出错。过往表现不代表未来结果。