

Recession Indicators 2026: What the Data Say as Stocks Slide and the Fed Stays Hawkish
Recession indicators 2026 explained: jobs, the yield curve, GDP, ISM, housing and the Fed, with latest readings and how investors should position portfolios.

Key Takeaway
Every sharp stock market sell-off revives the same question: is a recession coming? In mid-November 2026 the question feels urgent. The S&P 500 fell 1% to 7,340.53 on November 17, the Dow dropped 1.6%, and AI and software names led a second straight day of heavy losses, according to AP's market recap. The Federal Reserve raised rates in September for the first time since 2023, two officials dissented in favor of another hike in October, and the 10-year Treasury yield was trading above 5.1%. It is easy to read all of that as the opening act of a downturn.
The recession indicators themselves tell a more complicated story. Hard data on output and jobs are still solid: the Bureau of Economic Analysis put third-quarter real GDP growth at a 3.4% annual rate, payrolls rose 165,000 in October, and the unemployment rate dipped to 4.1%. Soft data and rate-sensitive corners are much weaker: consumer sentiment sits near 51, homebuilder confidence hit a 14-year low, and October industrial production fell 0.4%. That split is the real story for investors in late 2026.
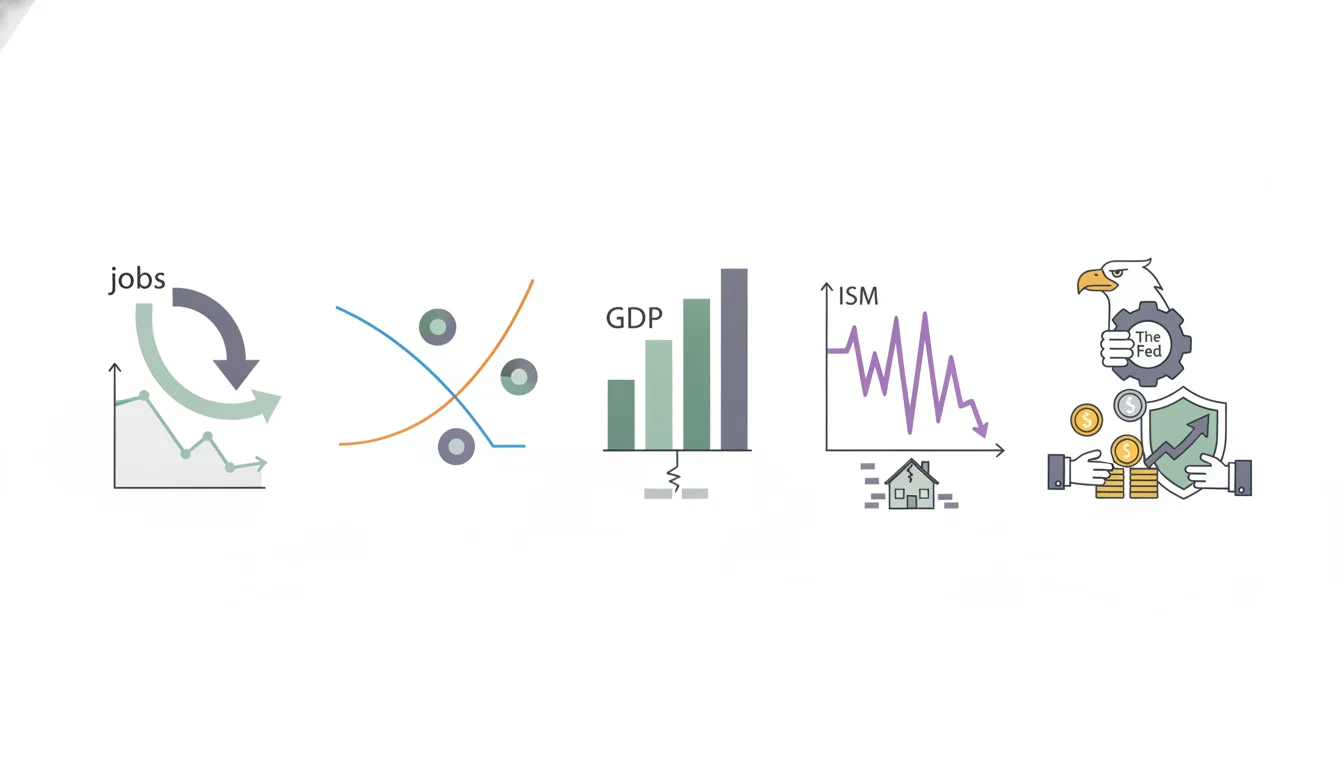
This guide walks through the recession indicators that actually matter, shows where each one stands with as-of dates and named sources, and explains how to translate a mixed dashboard into portfolio decisions. The goal is not to predict the exact start of the next recession, which professionals routinely miss, but to build a repeatable process for reading the data so that headlines and red screens do not make the decision for you.
Why Recession Indicators Matter More Than Market Headlines
A falling market is not the same as a shrinking economy
Stocks are a forward-looking, sentiment-heavy asset, and they can fall hard without the economy contracting at all. The current sell-off has been concentrated in AI, semiconductors, and software, where valuations ran far ahead of earnings, rather than spread evenly across the economy. The Philadelphia Semiconductor Index fell 5.3% on November 16 alone, according to Zacks, while sectors tied to everyday spending held up far better. When a correction is driven by valuation and positioning in one theme, the economic signal is weaker than the price action suggests.
The official definition is broad and slow
In the United States, recessions are dated by the National Bureau of Economic Research, which looks for a significant decline in activity spread across the economy and lasting more than a few months. The committee typically announces turning points long after they happen, sometimes a year or more later. That lag is why investors lean on indicators: they are imperfect, but they are available in real time. The catch is that no single indicator has a perfect record, so the useful skill is reading several together.
Leading, coincident, and lagging signals
It helps to sort indicators by timing. Leading indicators, such as the yield curve, building permits, and the Conference Board's Leading Economic Index, tend to turn before the cycle does. Coincident indicators, such as payrolls, industrial production, and real income, describe the economy as it is right now. Lagging indicators, such as the unemployment rate and core inflation, often confirm a turn only after it is underway. A credible recession call usually needs leading signals to deteriorate first and coincident data to follow.
The Labor Market: The Indicator That Decides Everything
What the October jobs report actually showed
The labor market is the backbone of consumer spending, and it remains the single most important recession indicator. The Bureau of Labor Statistics reported on November 6 that nonfarm payrolls rose by 165,000 in October, well above the consensus estimates of roughly 60,000 cited by several outlets. The unemployment rate fell to 4.1%, and average hourly earnings rose 0.4% to $38.00. The BLS also noted the jobless rate has held in a narrow 4.1% to 4.3% range since March. Recessions almost always begin with a clear upward break in unemployment, and that break has not appeared.
The Sahm rule is nowhere near triggering
The Sahm rule, created by economist Claudia Sahm, signals recession when the three-month average unemployment rate rises 0.5 percentage points above its low over the prior 12 months. With unemployment confined to a 4.1% to 4.3% band for most of 2026 and the latest print at the bottom of that range, the gap is far below the 0.5 threshold. The rule is a confirmation tool rather than a forecast, since it usually triggers around the start of a downturn. Still, its current reading argues that the economy was not slipping into recession as of October.
Where the cracks are showing
Not every labor gauge looks healthy. The broader U-6 underemployment rate, which includes part-time workers who want full-time hours, rose to 7.9% from 7.6% in October, according to the BLS. Weekly initial jobless claims edged up to 200,000 for the week ending November 7, per the Labor Department, though that level is still historically low. Investors should watch claims every Thursday: a sustained move toward 250,000 or higher would be a much more meaningful warning than a single bad week in the stock market.
The Yield Curve and the Fed: Tight Money Without a Contraction
A curve that has un-inverted
The spread between 10-year and 2-year Treasury yields is the most famous recession indicator because an inverted curve preceded most postwar recessions. As of the afternoon of November 17, the 10-year yield was about 5.12% and the 2-year about 4.81%, a positive spread of roughly 31 basis points based on market data reported that day. Historically, recessions have often started after the curve re-steepens from inversion rather than during the inversion itself, which is why a positive curve is not automatically reassuring. The level of yields matters too: borrowing costs above 5% at the long end weigh on housing and corporate refinancing.
The Fed is leaning hawkish
The Federal Reserve raised the federal funds target range by 25 basis points to 3.75% to 4.00% on September 16, its first hike since 2023, according to the Fed's press release. At the October 28 meeting it held rates steady in a 10-2 vote, with Governor Lisa Cook and Cleveland Fed President Beth Hammack dissenting in favor of another hike. Chair Kevin Warsh said "inflation is too high, and has been for too long," according to press conference coverage. The next decision is due December 9, and reports after the October meeting said traders had priced a year-end hike.
Why policy mistakes are the recession risk to watch
Late-cycle recessions are often triggered by central banks tightening into a slowdown they underestimate. Inflation gives the Fed a reason to stay firm: the BLS reported October CPI up 0.4% month over month, with core up 0.3%, both above forecasts, after headline inflation ran at 3.7% year over year in September. If the Fed keeps hiking while housing and manufacturing soften, the risk of an overtightening recession in 2027 rises. Investors should track the December dot plot and whether policymakers start to emphasize labor-market risks alongside inflation.
Growth and Production: Strong Headlines, Softer Details
Third-quarter GDP surprised to the upside
The BEA's advance estimate showed real GDP growing at a 3.4% annual rate in the third quarter of 2026, up from 2.2% in the second quarter, with consumer spending and AI-related business investment doing much of the work. That is not what an economy on the edge of contraction typically looks like. The second estimate is scheduled for November 25 and the third for December 23, so investors should expect revisions, but even a meaningful downgrade would leave growth positive.
Manufacturing surveys versus actual output
The ISM Manufacturing PMI rose to 55.5 in October, its 10th straight month of expansion, with all five main subindexes above 50, according to the Institute for Supply Management. Yet the Federal Reserve's October industrial production report showed total output falling 0.4%. The details matter: manufacturing output rose 0.3%, while utilities dropped 4.3% and mining fell 0.8%, a pattern several economists attributed largely to weather. A drop driven by utilities is far less worrying than a broad decline in factory output, which is why reading past the headline number is essential.
The leading index is flat, not falling
The Conference Board's Leading Economic Index was unchanged at 99.6 in September 2026, after a small decline in August, according to the organization's release. Its six-month growth rate hovered around zero rather than plunging, which is a meaningful difference from the persistent declines seen before past downturns. A flat LEI says momentum is modest and fragile, not that a recession is imminent. Investors should watch whether the next releases start to show broad-based declines across components.
The Weak Spots: Housing and Consumer Confidence
Homebuilders are flashing red
Housing is the most rate-sensitive sector of the economy, and it is clearly struggling. The National Association of Home Builders' housing market index fell to 29 in October, a 14-year low, and RTTNews reported a further slump in November. Mortgage rates track long-term Treasury yields, so a 10-year yield above 5% keeps affordability stretched. Historically, housing has often weakened well before broader recessions, which is why it deserves a place on any dashboard even when the rest of the economy looks fine.
Consumer sentiment is low but improving
The University of Michigan's preliminary consumer sentiment index rose to 51.0 in November from 48.0 in October, beating forecasts, and year-ahead inflation expectations eased to 4.3% from 4.7%. A reading near 51 is very low by historical standards, yet consumers have kept spending, as the GDP data show. Sentiment has been a poor timing tool in recent years because people often say they feel bad while continuing to shop. The final November reading is due November 20 and is worth checking for revisions.
When soft data and hard data disagree
The defining feature of the 2026 dashboard is the gap between surveys and spending. Soft data captures mood, inflation frustration, and political noise, while hard data records what households and companies actually do. When the two diverge, hard data usually wins over a horizon of a few quarters, unless a shock such as a credit event, an oil spike, or a hiring freeze closes the gap from the downside. That is why the labor market sits at the center of any recession call.
Investors who want to keep this dashboard current without checking a dozen release calendars can automate the routine. Alphio's Scheduled Task feature lets you set recurring checks, such as a Thursday jobless claims summary or a monthly jobs-report digest, so the data arrives on a schedule instead of through market panic.

How Stocks Behave Before and During Recessions
Markets tend to move before the economy
Equities have historically started falling before recessions begin and started recovering before they end, because prices reflect expectations of future earnings. That means investors who wait for official confirmation often sell near the bottom. It also means a sell-off can be a false alarm: markets have suffered sharp corrections many times without a recession following. The 2026 decline, concentrated in high-valuation technology, looks more like a repricing of growth expectations than a broad bet on a contracting economy, at least so far.
Earnings revisions are the bridge between data and prices
The clearest link between recession indicators and stock prices is corporate earnings. In a genuine recession, analysts cut forward earnings estimates across most sectors, not just in one crowded theme. If you see revisions falling for banks, industrials, and consumer discretionary companies at the same time, the market is starting to price a broader slowdown. Watching cyclical bellwethers such as Caterpillar can help, since heavy equipment demand is sensitive to construction, mining, and capital spending.
Sector leadership as a real-time signal
Rotation patterns can also reveal how the market reads the cycle. Defensive sectors such as consumer staples, health care, and utilities tend to outperform when investors expect slower growth, while small caps, banks, and industrials lead when they expect expansion. Fund managers are clearly shifting: TheStreet reported that Bank of America's November fund manager survey showed the biggest cut to technology overweights since 2006. Tracking whether that money flows to defensives or to cyclicals tells you which economic story professionals are betting on.
Building a Recession-Ready Portfolio Without Predicting the Date
Stress-test instead of forecast
Rather than guessing whether a recession starts in 2027, ask how your portfolio would hold up if one did. A typical recession has historically brought a significant drop in stock prices and earnings, a rise in unemployment, and lower interest rates as the Fed eventually eases. Estimate what a 25% to 30% equity drawdown would mean for your net worth, income needs, and sleep. If the answer is uncomfortable, adjust allocation now, while markets are open and orderly, rather than in a panic later.
Quality, cash flow, and balance sheets
Companies with steady free cash flow, modest debt, and pricing power have generally held up better in downturns than highly leveraged or speculative names. With yields above 5% on the long end, firms that must refinance heavy debt face real pressure. A recession-aware stock portfolio tilts toward quality without abandoning growth entirely, because the recovery phase often rewards cyclical and growth stocks first. Bonds also regain their role as a hedge when yields are this high, since falling rates in a slowdown would lift their prices.
Write rules before you need them
The most expensive recession mistakes are emotional: selling everything near a low or concentrating in the asset that just fell most. Writing rules in advance, such as rebalancing bands, maximum position sizes, and the specific indicator readings that would make you more defensive, keeps decisions consistent. For investors who prefer to follow disciplined strategies from experienced traders, Alphio's Copy Trade feature offers a way to mirror a strategy while still setting your own allocation limits.

A Practical Recession Indicator Checklist for 2026
The dashboard to review each month
A focused dashboard beats an overwhelming one. The core set below covers leading, coincident, and lagging signals, with the latest readings cited in this guide:
- Unemployment rate and Sahm rule gap (4.1% in October, far from trigger)
- Weekly initial jobless claims (200,000 for the week ending November 7)
- 10-year minus 2-year Treasury spread (about +31 basis points on November 17)
- ISM Manufacturing PMI (55.5 in October)
- Conference Board LEI (flat at 99.6 in September)
- NAHB housing index and mortgage rates (29 in October, a 14-year low)
- Fed policy path and inflation (3.75% to 4.00% target range, December 9 decision)
What would change the call
The current picture is a slowing, tight-money economy, not a recession. Several developments would change that: unemployment rising to 4.5% or higher, claims climbing steadily above 250,000, ISM falling back below 50, the LEI resuming steady declines, or broad earnings estimate cuts outside technology. Two or three of these moving together would justify a more defensive stance. One alone, especially a sell-off in a single crowded sector, usually would not.
Upcoming dates to mark
The next few weeks are dense with data. The final November consumer sentiment reading arrives November 20, the second estimate of third-quarter GDP on November 25, the November jobs report on December 4, the Fed's decision with new projections on December 9, and November CPI on December 10, according to the respective agency calendars. Each release can either reinforce the soft-landing case or start to tilt the dashboard toward a recession.
Conclusion
The recession indicators of late 2026 do not line up neatly. Growth, jobs, and manufacturing surveys still point to expansion, while housing, sentiment, and a hawkish Fed point to rising risk. The stock market's slide has been led by expensive technology names, which says more about valuations than about an economy already in contraction. The honest conclusion is that recession risk for 2027 is elevated but not confirmed, and the labor market will be the deciding signal.
For investors, the right response is process, not prediction. Track a short list of indicators on a schedule, stress-test your portfolio against a realistic downturn, favor quality balance sheets, and write your rules before the next scary headline. Alphio can support that discipline: Scheduled Task can deliver your recession dashboard on a fixed cadence, Conversational Trading lets you ask questions about positions and market data in plain English, and Autonomous Trading can execute rules you define with clear risk limits. None of these tools can guarantee returns or call the exact turn in the cycle, but they can help you act on evidence instead of fear.
FAQs
What are the most reliable recession indicators?
No single indicator is perfect, but the labor market (unemployment rate, Sahm rule, and jobless claims), the Treasury yield curve, the Conference Board Leading Economic Index, and manufacturing surveys like the ISM PMI have the strongest track records. Reading them together across leading, coincident, and lagging categories gives a far more reliable picture than any one signal.
Is the US in a recession in November 2026?
Based on data available as of mid-November 2026, no. Third-quarter GDP grew at a 3.4% annual rate in the BEA's advance estimate, October payrolls rose 165,000, and unemployment was 4.1%, although housing and consumer sentiment are weak and the Fed is leaning hawkish.
Does a stock market sell-off mean a recession is coming?
Not necessarily. Stocks often fall ahead of recessions, but they also suffer many corrections without one following, especially when declines are concentrated in a single high-valuation theme such as AI and software. Broad earnings estimate cuts across sectors are a stronger sign that markets are pricing a real downturn.
What is the Sahm rule and what does it show now?
The Sahm rule signals recession when the three-month average unemployment rate rises 0.5 percentage points above its low of the prior 12 months. With unemployment held between 4.1% and 4.3% since March 2026 and at 4.1% in October, the indicator is well below its trigger level.
How should investors prepare for a possible recession?
Focus on process rather than timing: stress-test your portfolio against a 25% to 30% equity drawdown, favor companies with strong balance sheets and cash flow, and keep some bond or cash exposure. Writing rebalancing rules and defensive triggers in advance helps you avoid emotional decisions during a sell-off.
Ähnliche Artikel
- Leveraged ETFs in the 2026 Sell-Off: Why TQQQ and SOXL Dip Buyers Got Crushed by Volatility DecayLeveraged ETFs like TQQQ and SOXL fell hard in the 2026 sell-off. Learn how daily resets and volatility decay work, and how to size and time-box 3x trades.
- Dividend Stocks vs 5% Treasury Yields: How Income Investors Should Adapt in 2026With 10-year Treasury yields above 5% and the S&P 500 yielding about 1.1%, here is how to judge dividend stocks, avoid yield traps, and build income in 2026.
- Roth Conversion in a Down Market: How to Use the 2026 Sell-Off Before December 31Stocks fell 8% from their high. Learn how a Roth conversion in a down market works, how to size it with 2026 tax brackets, and the traps to avoid by Dec 31.
- Brent Crude Oil Price Forecast August 2026: Supply Risks and Geopolitical Tensions Fuel Market RallyBrent crude oil price forecast for August 2026: EIA forecasts $85/barrel as Middle East tensions and Strait of Hormuz disruptions support prices. Expert analysis and outlook.
- Nvidia Stock Earnings August 2026: What Investors Need to Know Before the Q2 ReportNvidia reports Q2 earnings on August 26, 2026. Get the latest NVDA stock analysis, earnings expectations, AI chip demand outlook, and price targets ahead of the report.
- Best AI Trading Bots – Top 12 Tools for Smarter InvestingDiscover the top 12 AI trading bots for smarter investing in 2026. Compare features, pricing, and benefits of leading automated trading platforms for stocks, crypto, and forex.