

How to Use Stock Scanners: A Beginner's Guide to Finding Opportunities
Learn how to use stock scanners effectively with this comprehensive guide. Discover scanner types, key parameters, and strategies to find profitable trading opportunities in real-time.

Key Takeaway
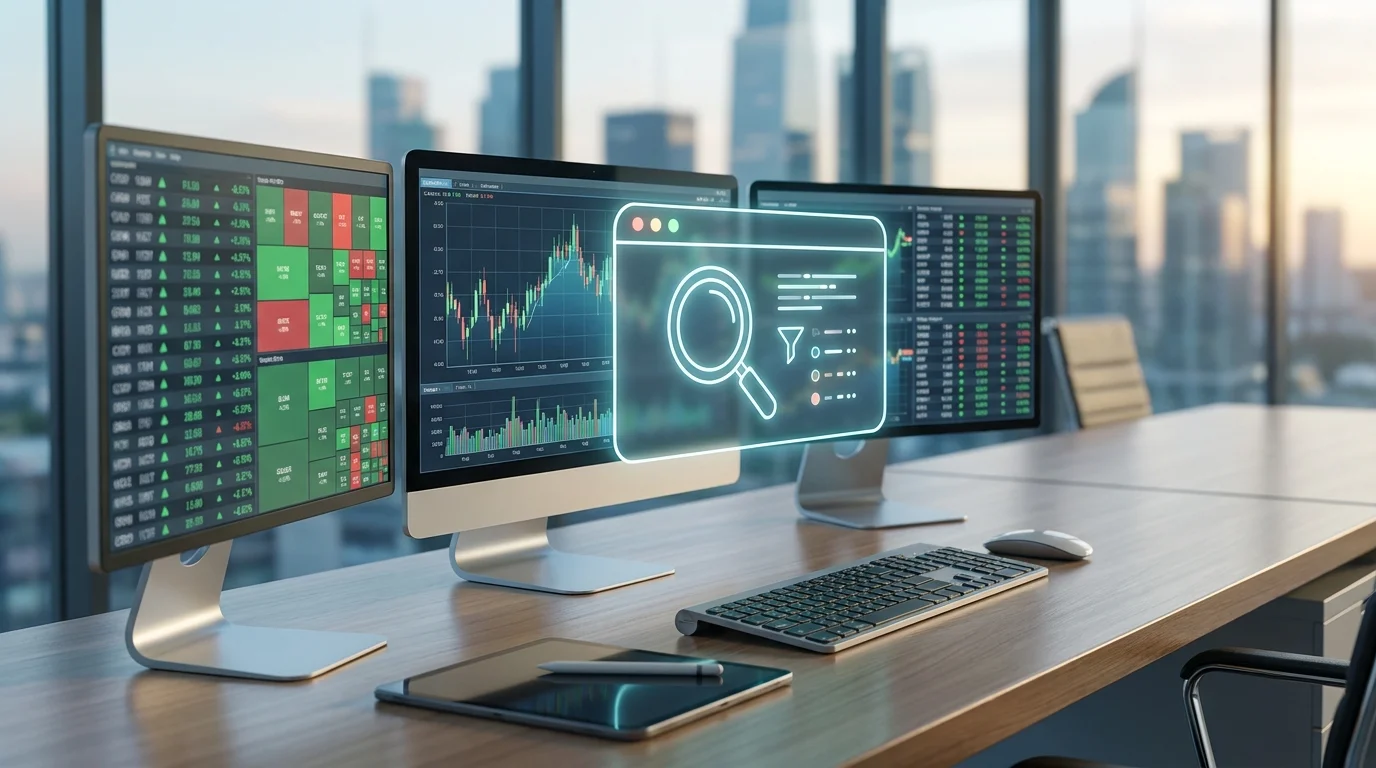
Stock scanners are powerful software tools that automatically filter through thousands of stocks to identify those meeting your specific trading criteria in real-time. Unlike static stock screeners that only work with end-of-day data, scanners continuously monitor the market during trading hours, alerting you to price movements, volume spikes, and technical breakouts as they happen. Mastering stock scanners can transform your trading by helping you discover opportunities you would never find manually, while saving countless hours of manual research.
For beginners, the key to success with stock scanners is starting simple and gradually building complexity. Focus on mastering basic parameters like price range, volume thresholds, and percentage changes before adding technical indicators or multi-condition filters. The most successful traders treat scanners as discovery tools rather than signal generators, using them to identify candidates that warrant deeper analysis rather than blindly executing trades based on scan results alone.
What Are Stock Scanners?
Stock scanners are specialized software applications designed to monitor financial markets continuously and identify securities that match predetermined criteria. These powerful tools serve as automated research assistants, sifting through thousands of stocks, ETFs, and other instruments to surface trading opportunities that align with your specific strategy and risk tolerance.
The fundamental purpose of a stock scanner is efficiency. Manual analysis of even a single stock can take hours when you consider reviewing financial statements, chart patterns, news catalysts, and market sentiment. Multiply that effort across the thousands of publicly traded companies, and comprehensive market coverage becomes impossible for individual traders. Scanners solve this problem by applying computational power to monitor the entire market simultaneously, alerting you only when securities meet your exact specifications.
Modern stock scanners have evolved significantly from their early iterations. Today's platforms offer real-time data feeds, customizable alert systems, integration with brokerage accounts for seamless execution, and sophisticated filtering capabilities that can combine multiple technical and fundamental criteria. Some advanced scanners even incorporate artificial intelligence and machine learning to identify patterns and predict potential breakouts based on historical data analysis.
The technology behind stock scanners relies on direct market data feeds that stream price, volume, and order book information in real-time. When you configure a scan with specific parameters, the software continuously evaluates incoming data against your criteria, instantly flagging matches and delivering notifications through various channels including desktop alerts, mobile push notifications, email, or SMS messages. This real-time capability is what distinguishes true scanners from static screening tools.
Stock Scanners vs. Stock Screeners: Understanding the Difference
While the terms "scanner" and "screener" are often used interchangeably in trading conversations, they represent fundamentally different tools with distinct use cases and capabilities. Understanding this distinction is crucial for selecting the right tool for your trading workflow and avoiding the frustration of expecting real-time alerts from a static screening tool.
Stock screeners are designed for end-of-day analysis and research. These tools work with historical data, typically updated once daily after market close, allowing you to filter stocks based on fundamental metrics, technical indicators, and financial ratios. Screeners excel at building watchlists, conducting research on potential investments, and identifying stocks that meet long-term investment criteria. They answer questions like "Which stocks have P/E ratios below 20, debt-to-equity ratios under 0.5, and revenue growth exceeding 15% annually?"
Stock scanners, by contrast, are built for real-time market monitoring. They process live data feeds during market hours, alerting you to price movements, volume anomalies, and technical breakouts as they occur. Scanners are essential tools for active traders, day traders, and swing traders who need to react quickly to market developments. A scanner might alert you when a stock breaks above its 20-day moving average on triple normal volume within the first hour of trading.
The practical implications of this difference are significant. If you're a long-term investor building a portfolio of quality companies, a screener is likely sufficient for your needs. You can run your criteria after market close, review the results at your leisure, and make investment decisions without time pressure. However, if you're an active trader seeking to capitalize on intraday momentum or breakout patterns, a scanner is indispensable. Market opportunities often last minutes or even seconds, and by the time you run an end-of-day screen, the opportunity has long since passed.
Many modern platforms blur these lines by offering both capabilities in integrated packages. These hybrid solutions allow you to use screening tools for research and building baseline watchlists, then apply real-time scanning to monitor those watchlists during trading hours. This combination leverages the strengths of both approaches, using screeners for comprehensive market research and scanners for tactical execution.
Types of Stock Scanners
The stock scanner ecosystem has diversified to serve different trading styles, asset classes, and analytical approaches. Understanding the various scanner types helps you select tools aligned with your specific trading methodology and market focus.
Fundamental Scanners
Fundamental scanners focus on company financials and business metrics rather than price action. These tools filter stocks based on accounting data, financial ratios, and business characteristics. Common fundamental parameters include market capitalization, revenue and earnings growth rates, profit margins, return on equity, debt levels, and valuation multiples like P/E, P/B, and P/S ratios.
Fundamental scanners appeal to value investors, growth investors, and long-term position traders who base decisions on business quality and valuation rather than short-term price movements. These scanners typically update less frequently than technical scanners since underlying financial data changes quarterly rather than minute-by-minute. However, some advanced fundamental scanners can alert you to real-time news events, earnings announcements, and SEC filings that might impact a company's investment thesis.
Technical Scanners
Technical scanners monitor price action, volume patterns, and indicator values to identify trading opportunities based on chart patterns and statistical analysis. These are the most common scanners among active traders and day traders who rely on technical analysis for entry and exit decisions. Technical scanners can monitor virtually any quantifiable chart pattern or indicator condition, from simple moving average crossovers to complex multi-timeframe pattern recognition.
Popular technical scanning parameters include moving average relationships, support and resistance breaks, volume spikes relative to average, RSI overbought/oversold conditions, MACD crossovers, Bollinger Band squeezes and breakouts, and candlestick pattern formations. Advanced technical scanners may also incorporate custom indicator calculations, Fibonacci retracement levels, and harmonic pattern recognition.
Intraday Scanners
Intraday scanners are specifically designed for day traders who open and close positions within the same trading session. These scanners focus on real-time momentum, volatility, and liquidity characteristics essential for short-term trading success. Intraday scanners typically update every few seconds or even tick-by-tick, providing immediate alerts when stocks exhibit unusual price or volume behavior.
Key intraday scanning criteria include percentage gainers and losers, stocks hitting new intraday highs or lows, unusual volume relative to average daily volume, stocks breaking pre-market highs or lows, and gap up or gap down movements. Many intraday scanners also incorporate Level 2 data analysis, monitoring order flow and identifying accumulation or distribution patterns in real-time.
Post-Market Scanners
Post-market scanners analyze after-hours and pre-market trading activity to identify stocks experiencing significant moves outside regular trading hours. These scanners are valuable for swing traders and position traders who want to understand overnight developments and prepare for the next trading session. After-hours moves often foreshadow next-day momentum, particularly when driven by earnings releases, news events, or macroeconomic announcements.
Post-market scanning parameters typically focus on percentage changes, volume analysis, and news catalysts. Traders use these scanners to identify stocks that might gap at the next market open, assess the strength of after-hours trends, and prepare trading plans for the following session. Some post-market scanners also integrate with news services to correlate price movements with specific catalysts.
How to Use Stock Scanners Effectively
Mastering stock scanners requires more than simply setting parameters and waiting for alerts. Effective scanner usage involves strategic configuration, disciplined workflow integration, and continuous refinement based on performance analysis. The following strategies will help you maximize the value of your scanning tools.
Setting Up Real-Time Alerts
Real-time alerts are the core functionality that makes stock scanners valuable for active trading. Proper alert configuration requires balancing comprehensiveness with precision, ensuring you receive notifications for genuine opportunities while avoiding alert fatigue from false positives.
Price breakout alerts represent one of the most common and effective scanner configurations. These alerts notify you when a stock breaks above resistance levels, below support levels, or through specific price thresholds you've identified. When configuring breakout alerts, consider incorporating volume confirmation to filter out low-conviction moves. A breakout on heavy volume indicates institutional participation and higher probability of follow-through, while breakouts on light volume often fail quickly.
Volume anomaly alerts help identify unusual trading activity that often precedes significant price movements. Configure your scanner to flag stocks trading at two to three times their average daily volume, as these spikes frequently coincide with news events, institutional accumulation, or technical breakouts. Pay particular attention to volume spikes occurring at key technical levels, as these often represent high-probability trading setups.
For momentum traders, percentage change alerts identify stocks making significant intraday moves. Rather than chasing every gainer, focus on stocks breaking through key psychological levels or showing sustained momentum over multiple timeframes. Consider combining percentage alerts with minimum volume thresholds to ensure sufficient liquidity for position entry and exit.
Building and Managing Watchlists
Watchlists are the bridge between scanner discovery and trading execution. Rather than attempting to trade every stock your scanner identifies, develop a systematic process for evaluating scan results and maintaining curated watchlists of the most promising candidates.
Start by creating tiered watchlists based on setup quality and proximity to entry triggers. Your primary watchlist should contain stocks with the highest-probability setups that are approaching actionable entry points. A secondary watchlist can track stocks with promising characteristics that require additional confirmation or are further from trigger levels. This tiered approach helps focus your attention on the best opportunities while maintaining awareness of developing setups.
Review and refresh your watchlists regularly, removing stocks that have triggered, failed their setups, or no longer meet your criteria. Most successful traders review their watchlists at least twice daily, once before market open to prepare for the session and once after market close to plan for the following day. This discipline prevents watchlist bloat and ensures you're always focused on the most relevant opportunities.
Consider using your scanner to monitor existing watchlists in addition to scanning the broader market. Many platforms allow you to apply scanning criteria specifically to your watchlist stocks, alerting you when tracked positions meet entry conditions or when existing positions trigger exit signals. This focused scanning often yields higher-quality alerts than broad market scans.
Combining Scanners with News Analysis
Scanner alerts become significantly more actionable when combined with understanding of the catalysts driving price movements. A stock breaking out on heavy volume is interesting; a stock breaking out on heavy volume following positive earnings guidance or FDA approval is a much higher-probability trade.
Develop a workflow that integrates news analysis with your scanning routine. When your scanner identifies a potential opportunity, immediately check for news catalysts before considering entry. Major news services, SEC filing databases, and company press releases should be readily accessible, allowing you to quickly assess whether a price move is fundamentally justified or purely technical.
Be particularly attentive to the timing relationship between news and price action. Stocks that begin moving before public news releases may indicate informed trading or leaked information, while stocks moving after well-publicized news may be experiencing delayed reactions or momentum continuation. Understanding these dynamics helps you assess the sustainability of price movements and the risk of immediate reversals.
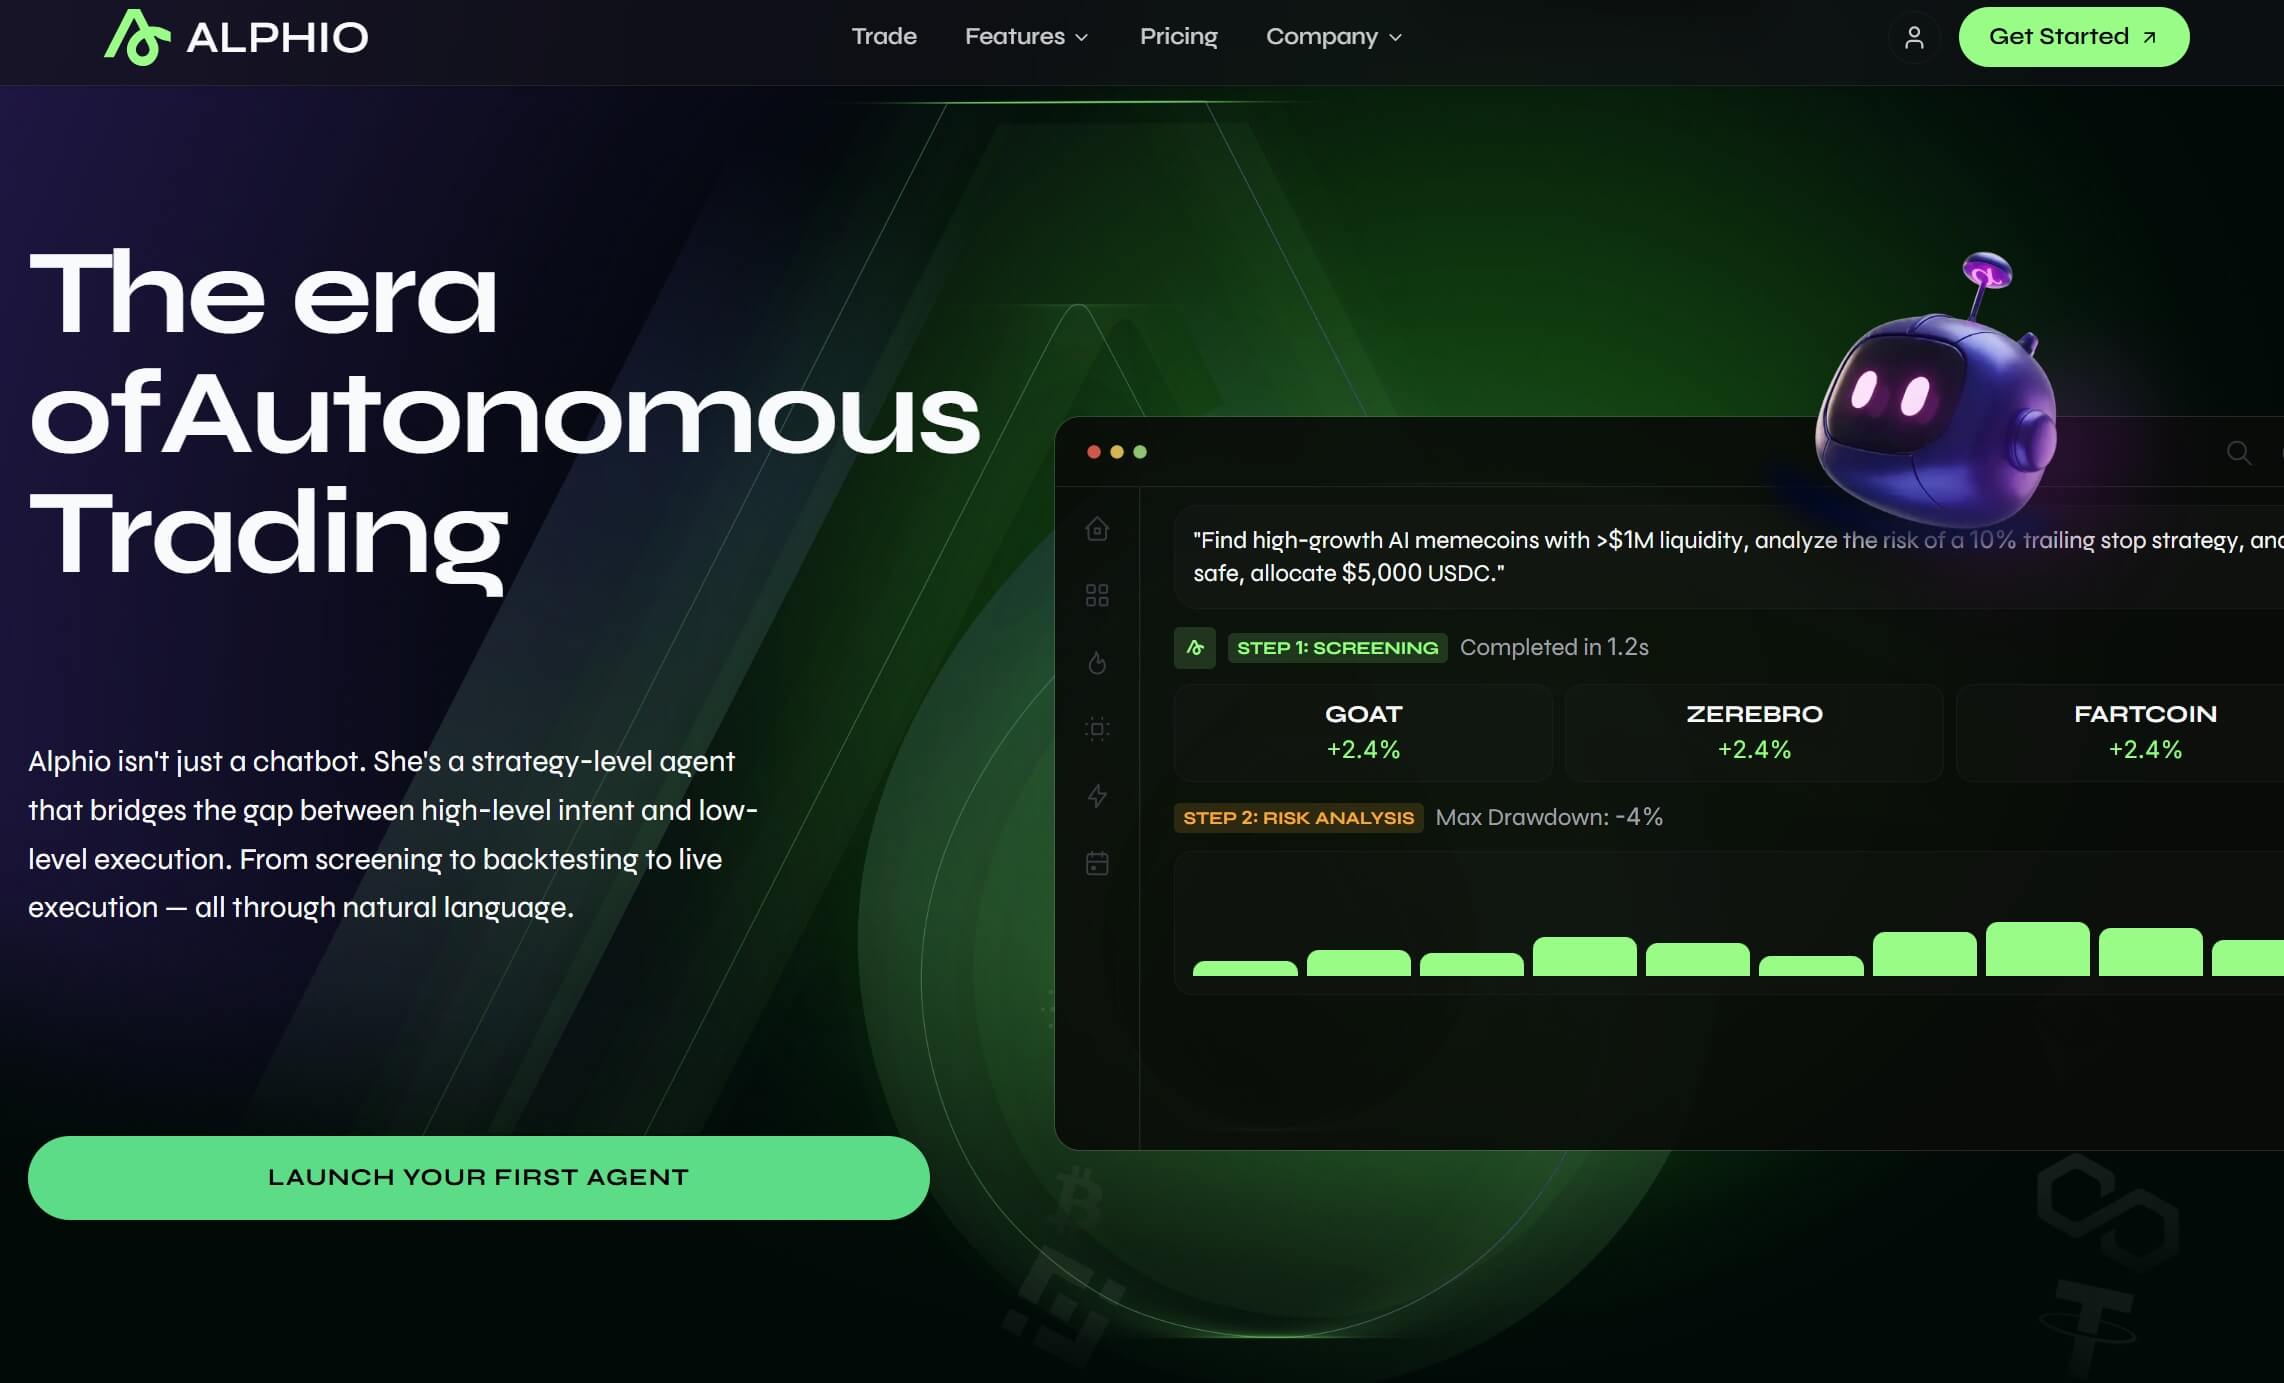
For traders seeking to automate their trading strategies, consider using Alphio AI's copy trading feature to mirror successful traders and smart money wallets. This can complement your scanner-based approach by providing additional validation for potential trades.
Key Stock Scanner Parameters
The effectiveness of your scanning depends heavily on selecting appropriate parameters that align with your trading strategy and market conditions. While the specific parameters you use will evolve with experience, understanding the core categories of scanning criteria provides a foundation for building effective scans.
Price Parameters
Price-based parameters filter stocks based on their absolute price levels or price changes over specified timeframes. These are among the simplest yet most effective scanning criteria, as price action ultimately determines trading profitability.
Price range filters allow you to focus on stocks within your preferred trading price band. Many traders avoid stocks below $5 due to liquidity concerns and increased volatility, while others specifically target low-priced stocks for their explosive percentage move potential. Define your price comfort zone based on your account size, risk tolerance, and execution capabilities.
Percentage change parameters identify stocks experiencing significant price movements, whether gains or losses. Intraday traders often scan for stocks up or down more than 5% from the previous close, while swing traders might use daily scans looking for stocks moving 10% or more over the past week. The appropriate threshold depends on your trading timeframe and the typical volatility of your target stocks.
Price position parameters filter stocks based on their location relative to historical price ranges. Scanning for stocks making new 52-week highs or lows can identify strong trending stocks or potential reversal candidates. Similarly, scanning for stocks trading near support or resistance levels helps identify potential breakout or bounce setups.
Volume Parameters
Volume analysis provides crucial context for price movements, helping distinguish between meaningful trends and random noise. Volume parameters should be a component of virtually every scan you create.
Relative volume compares current trading volume to historical averages, highlighting unusual activity. A common approach scans for stocks trading at two to three times their average daily volume, as these spikes often coincide with significant news or technical events. Some scanners allow you to specify the comparison period, such as comparing today's volume to the 20-day or 50-day average.
Absolute volume filters ensure sufficient liquidity for your intended position size. If you plan to trade 1,000 share positions, you need stocks trading hundreds of thousands or millions of shares daily to ensure easy entry and exit without significant slippage. Define minimum absolute volume thresholds based on your position sizing and the liquidity requirements of your strategy.
Volume pattern recognition identifies specific volume signatures associated with high-probability setups. These might include volume spikes accompanying breakouts, declining volume during consolidations preceding expansions, or accumulation patterns showing steady buying pressure over multiple sessions.
Float and Market Cap Parameters
Understanding a stock's supply characteristics helps assess its potential volatility and the sustainability of price movements. Low-float stocks can experience dramatic price swings on relatively modest buying pressure, while large-cap stocks typically move more gradually but offer greater liquidity.
Float parameters filter stocks based on the number of shares available for public trading. Low-float stocks, typically defined as those with fewer than 20 million shares in the float, are favorites among momentum traders for their explosive move potential. However, low-float stocks also carry higher risk of sudden reversals and difficulty exiting large positions. Consider your risk tolerance and position sizing when setting float parameters.
Market capitalization filters focus on company size, which correlates with volatility, liquidity, and institutional coverage. Large-cap stocks offer stability and liquidity but limited percentage move potential, while small-cap and micro-cap stocks can deliver explosive gains but with significantly higher risk. Your market cap preferences should align with your trading timeframe, risk tolerance, and return objectives.
Technical Indicator Parameters
Technical indicators transform price and volume data into quantifiable signals that can be incorporated into scanning criteria. The specific indicators you use should align with your trading methodology and the types of setups you seek.
Moving average parameters identify stocks in various trend stages. Scanning for stocks above their 20-day and 50-day moving averages identifies uptrending stocks, while stocks below these averages may be in downtrends or consolidation phases. Moving average crossover scans identify stocks transitioning between trend states, potentially signaling entry or exit opportunities.
Momentum indicator parameters like RSI, MACD, and Stochastics identify overbought or oversold conditions. RSI scans might flag stocks with RSI below 30 for potential bounce plays or above 70 for potential shorts. MACD scans can identify momentum shifts through signal line crossovers or histogram divergences.
Volatility parameters using indicators like Bollinger Bands or Average True Range help identify stocks experiencing unusual volatility expansions or contractions. Bollinger Band squeeze scans identify stocks with historically low volatility that may be preparing for significant moves, while Band expansion scans capture stocks already experiencing heightened volatility.
StocksToTrade Scanner Features
StocksToTrade represents one of the most comprehensive scanning platforms available to retail traders, offering a robust feature set designed specifically for active trading. Understanding its capabilities provides insight into the advanced features available in professional-grade scanning tools.
Pre-Built Scanning Conditions
StocksToTrade includes an extensive library of pre-configured scans developed by professional traders, allowing users to immediately access proven scanning strategies without building criteria from scratch. These pre-built scans cover popular trading strategies including gap up and gap down plays, breakout patterns, momentum continuation setups, and reversal patterns.
The platform's Oracle algorithm combines multiple technical and fundamental factors to identify stocks with the highest probability of significant price movements. This proprietary scanning engine analyzes volume patterns, price action, news sentiment, and historical behavior to surface opportunities that might be missed by simpler single-factor scans.
Pre-built scans serve as excellent starting points for new users, providing immediate functionality while you learn the platform. As you gain experience, you can modify these existing scans or build entirely custom criteria tailored to your specific strategy and market view.
Chart Visualization Integration
Effective scanning requires seamless integration between scan results and chart analysis. StocksToTrade provides direct chart access from scan results, allowing immediate visual confirmation of setup quality and technical context.
The platform's charting capabilities include multiple timeframe analysis, enabling you to assess daily, hourly, and minute charts without leaving the scanning interface. This multi-timeframe perspective helps confirm that scan results align with your strategy across different time horizons and avoid false signals that might appear valid on only one timeframe.
Customizable chart layouts allow you to save preferred indicator configurations and quickly apply them to any stock from your scan results. This consistency in analysis helps maintain discipline and ensures you're evaluating all opportunities using the same criteria.
News Integration
StocksToTrade integrates news feeds directly into the scanning interface, providing immediate context for price movements identified by scans. When a stock triggers your scan criteria, you can instantly view recent news headlines, SEC filings, and social media sentiment to understand the catalyst behind the movement.
The platform's news filtering capabilities allow you to focus on specific types of catalysts relevant to your strategy. Earnings announcements, FDA decisions, merger announcements, and analyst upgrades/downgrades can each be tracked separately, helping you correlate scan results with specific types of fundamental events.
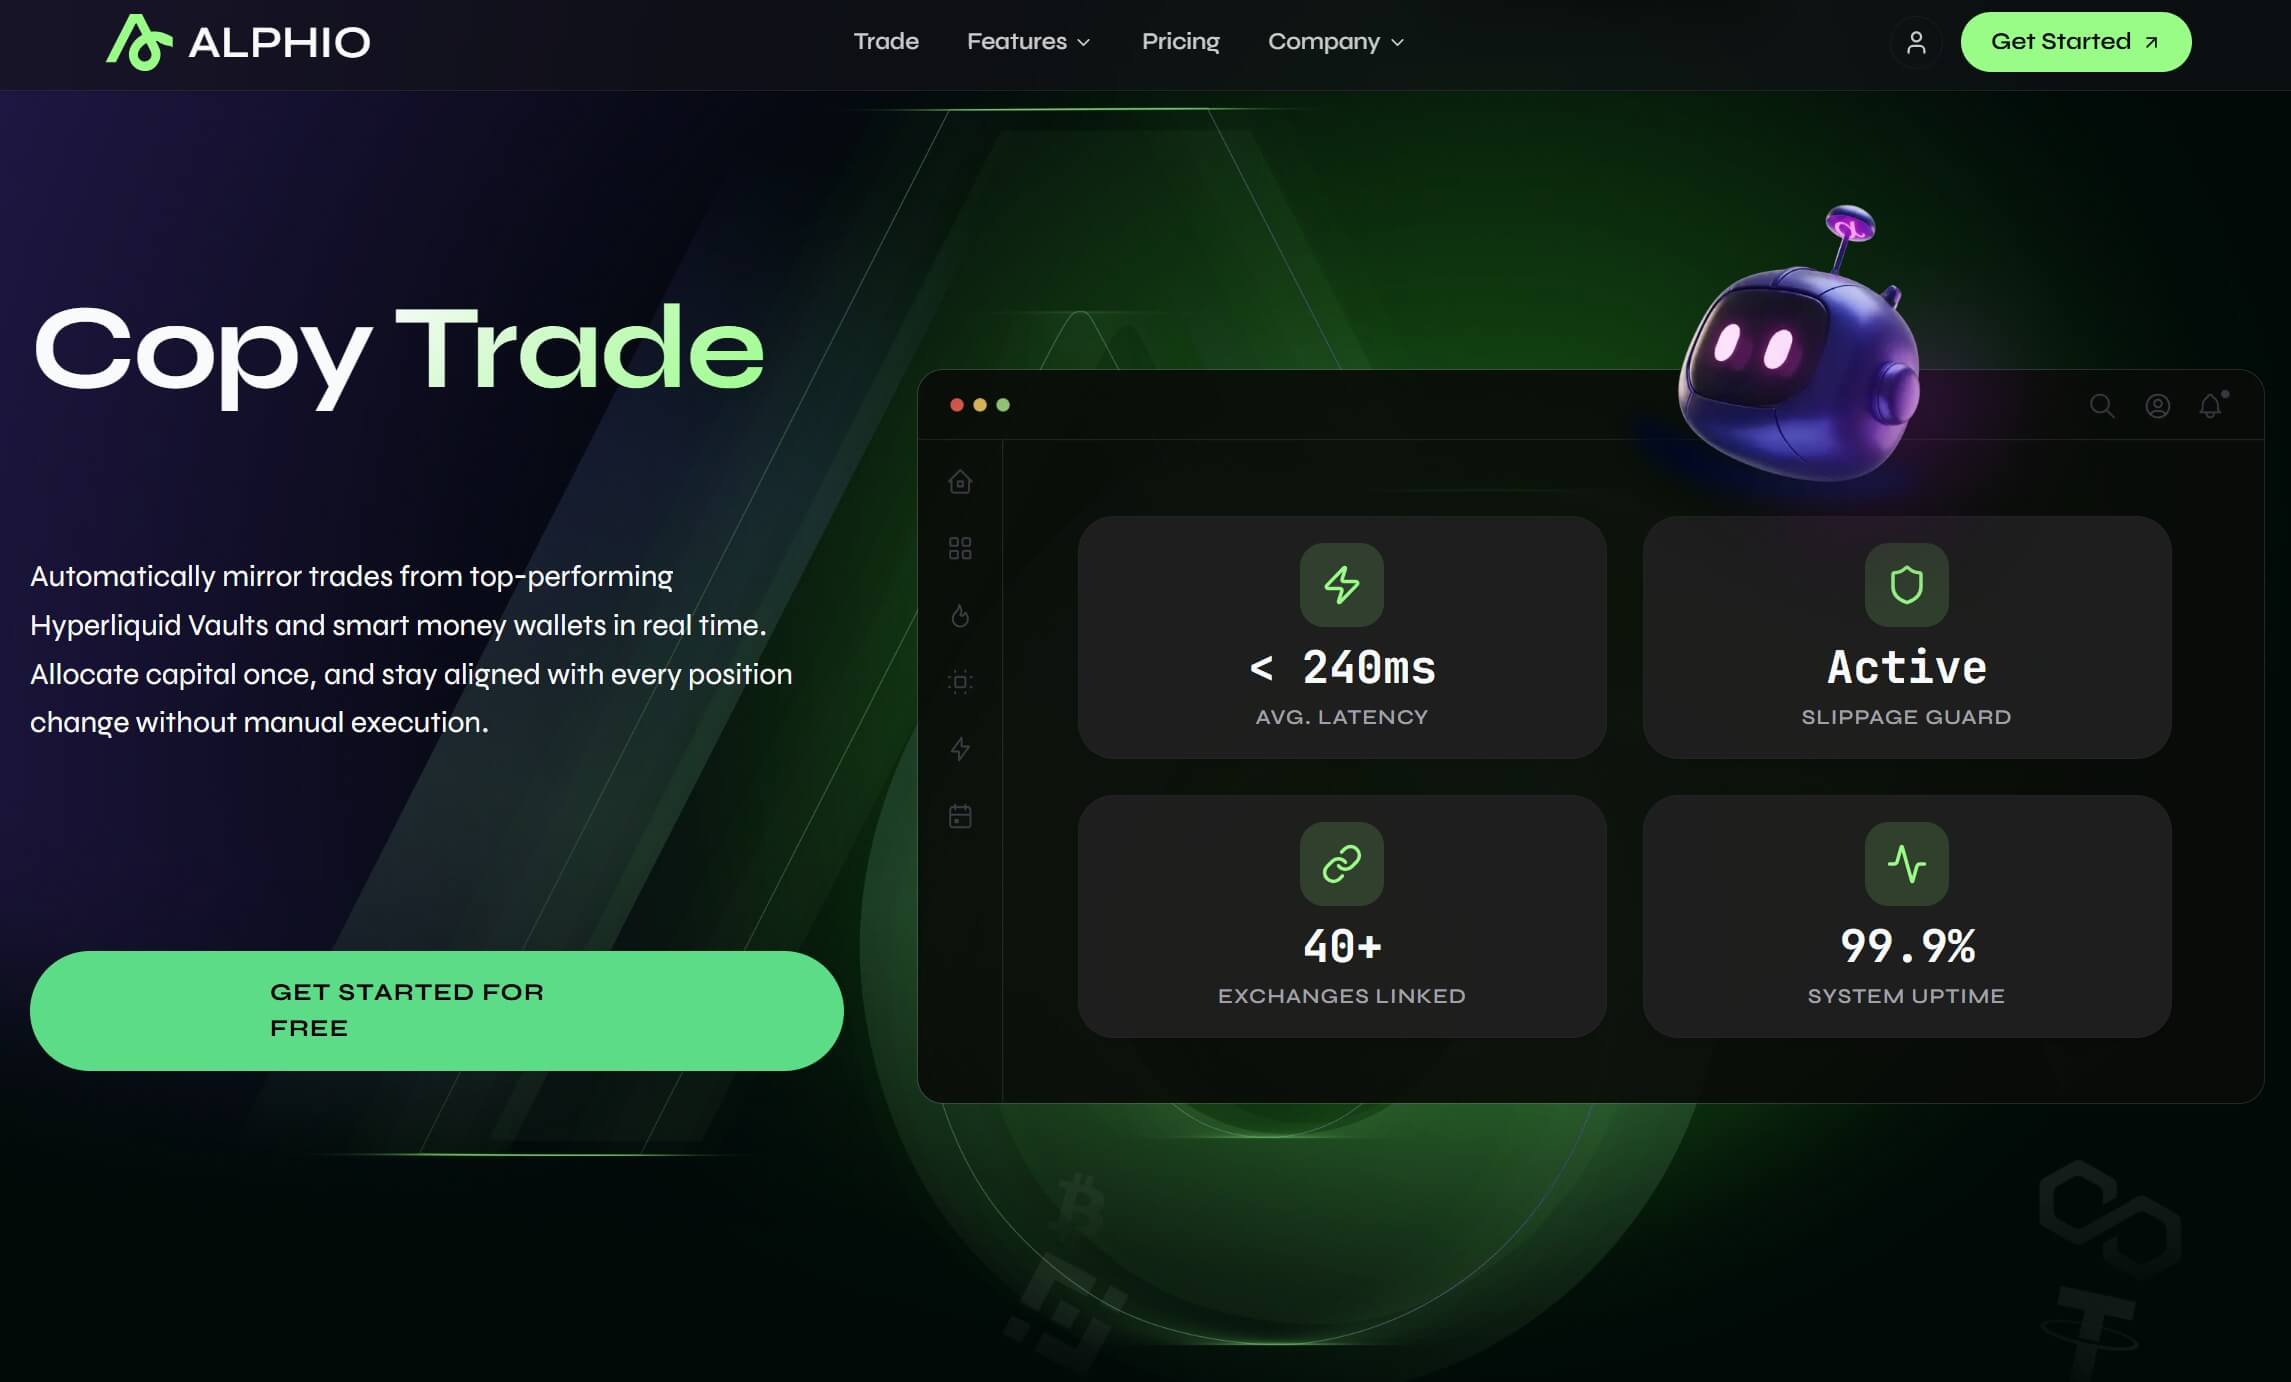
For traders looking to automate their workflow further, explore Alphio AI's agentic trading to automate your portfolio management with AI-powered strategies. This can work alongside your manual scanning to capture opportunities around the clock.
Advanced Scanner Techniques
Once you've mastered basic scanner configuration, advanced techniques can further enhance your trading edge by identifying more subtle opportunities and filtering out lower-probability setups.
Multi-Condition Scanning
Single-parameter scans often generate too many results or capture setups lacking sufficient confirmation. Multi-condition scanning combines multiple criteria to identify stocks meeting several favorable characteristics simultaneously, significantly improving signal quality.
Effective multi-condition scans layer complementary criteria that reinforce each other. For example, a momentum scan might require stocks to be up more than 5% intraday (price condition), trading at twice normal volume (volume condition), breaking above their 20-day high (technical condition), and accompanied by positive news (fundamental condition). Each additional filter reduces the number of results while increasing the probability that remaining stocks represent genuine opportunities.
When building multi-condition scans, consider the logical relationship between criteria. Some conditions work best as AND requirements, where stocks must meet all criteria simultaneously. Others might work better as OR conditions, where meeting any of several related criteria generates an alert. Understanding these logical relationships helps build scans that capture the setups you want without excessive false positives.
Time-Based Scanning
Market behavior varies significantly throughout the trading day, and time-based scanning adjusts your criteria to match these changing conditions. Different times of day favor different strategies, and your scans should reflect these temporal patterns.
Pre-market and opening bell scans focus on gap analysis and overnight news reactions. These scans typically look for stocks gapping significantly above or below previous closes, often with elevated pre-market volume indicating institutional interest. Opening range scans monitor the first 15-30 minutes of regular trading to identify stocks establishing clear directional trends early in the session.
Mid-day scans often focus on consolidation patterns and range-bound opportunities when volatility typically decreases. These scans might identify stocks holding morning gains and building bullish consolidations, or stocks forming bearish flag patterns after morning declines.
End-of-day scans capture closing momentum and potential overnight holds. These scans identify stocks making late-day breakouts, experiencing volume surges into the close, or showing institutional accumulation patterns in the final hour.
Sector and Market Context Scanning
Individual stock movements don't occur in isolation; they reflect broader sector trends and overall market conditions. Context-aware scanning incorporates market and sector analysis to identify stocks moving with rather than against the prevailing trend.
Sector rotation scans monitor relative strength between industry groups, identifying sectors experiencing unusual buying or selling pressure. When a sector shows collective strength, individual stocks within that sector become higher-probability long candidates. Conversely, sector weakness can provide short opportunities even in stocks with otherwise bullish individual characteristics.
Market correlation scans assess how individual stocks are moving relative to broad market indices. In strongly trending markets, stocks moving with the trend often provide safer opportunities than counter-trend plays. During range-bound or choppy markets, mean-reversion strategies targeting stocks diverging from the market may be more appropriate.
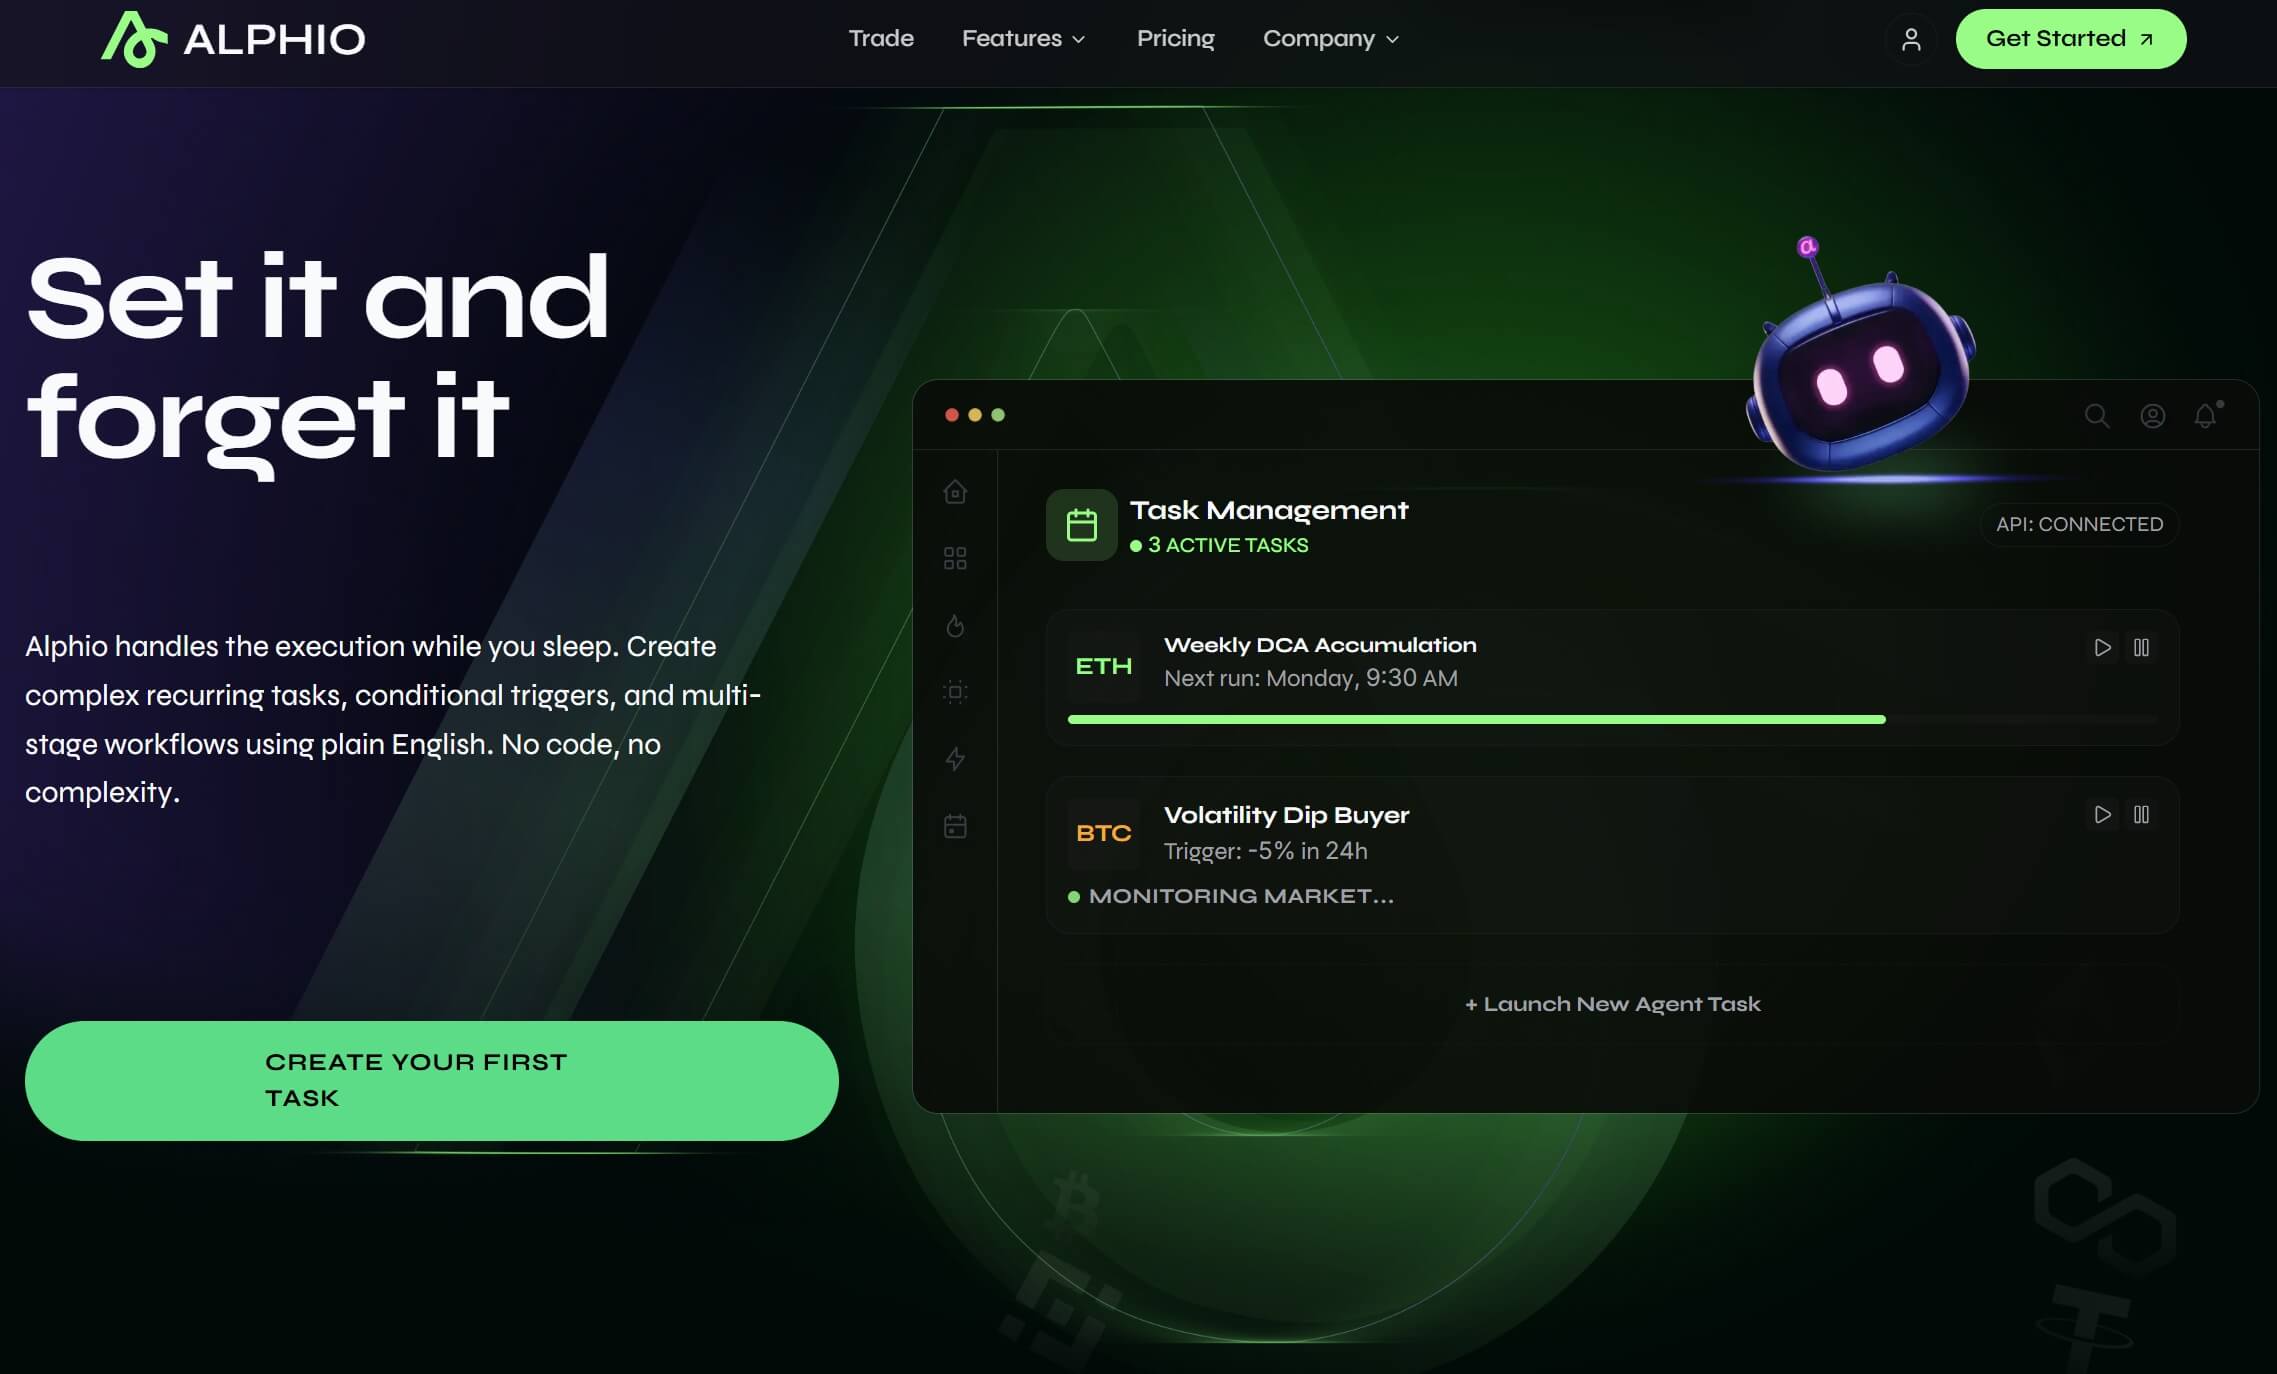
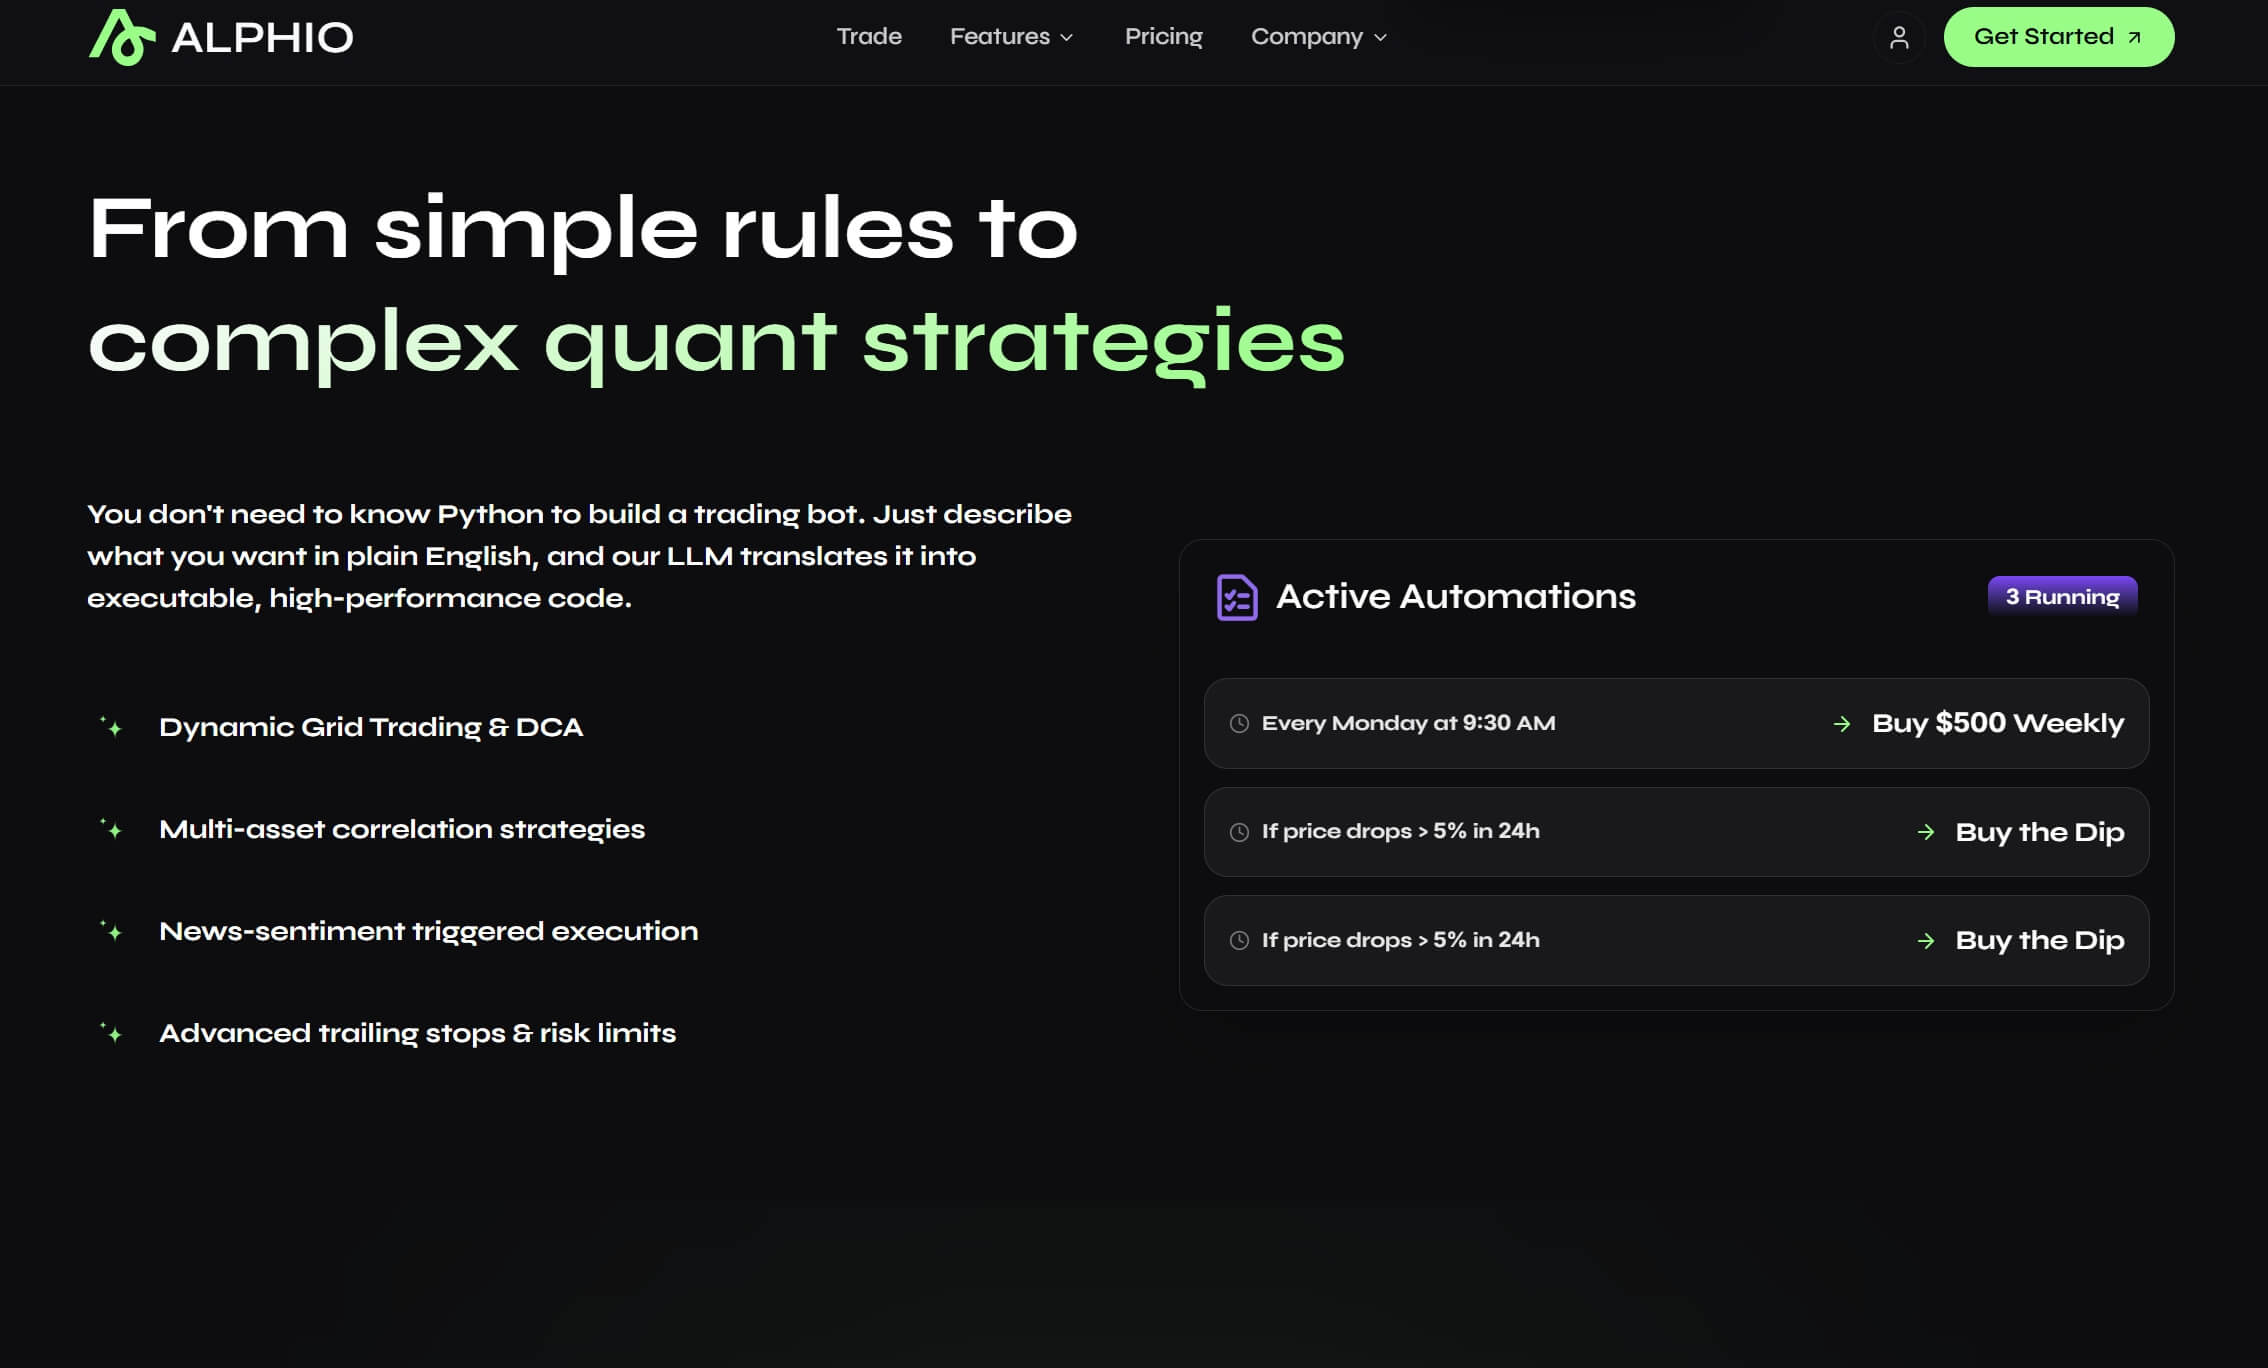
To set up conditional workflows for your scanning and trading activities, check out Alphio AI's scheduled task automations. This feature allows you to create automated rules that execute based on specific market conditions.
Scanner Best Practices and Common Mistakes
Even experienced traders can undermine their scanning effectiveness through poor practices or unrealistic expectations. Understanding common pitfalls and best practices helps you avoid frustration and maximize the value of your scanning tools.
Start Simple and Build Gradually
The most common mistake new scanner users make is creating overly complex scans with dozens of parameters, hoping to filter for "perfect" setups. This approach typically yields few or no results and prevents you from learning how individual criteria perform.
Instead, begin with simple scans using two to three basic parameters. A scan for stocks up more than 5% on double normal volume provides plenty of actionable opportunities while teaching you about momentum dynamics. As you gain experience and understand how these basic scans perform, gradually add additional criteria to refine your results.
Document your scan performance, tracking which criteria generate profitable opportunities and which produce false signals. This systematic approach to scanner optimization helps you build increasingly effective scans based on actual market experience rather than theoretical assumptions.
Validate Scanner Results
Scanners identify candidates; they don't provide trading signals. Every stock your scanner flags requires additional analysis before consideration for trading. Treat scan results as a starting point for research, not a buy or sell recommendation.
Develop a consistent validation routine for scan results. At minimum, review the chart pattern, check for news catalysts, assess sector context, and confirm adequate liquidity before adding a scanned stock to your watchlist. This validation step filters out false positives and ensures you're only spending analytical time on genuine opportunities.
Be particularly cautious of scanner results during unusual market conditions. High-volatility periods, low-volume holiday sessions, and major news events can produce anomalous scan results that don't represent normal trading opportunities. Adjust your scanning criteria or temporarily disable certain scans during these periods to avoid false signals.
Manage Alert Overload
Scanning too broadly generates excessive alerts, creating noise that obscures genuine opportunities and leads to decision fatigue. If you're receiving dozens of scanner alerts daily, your criteria are likely too broad or your timeframe too short.
Refine your scans to focus on the highest-probability setups for your specific strategy. It's better to receive three to five high-quality alerts daily than fifty marginal ones. Quality scanning focuses your attention on the best opportunities, while excessive scanning scatters your focus across mediocre setups.
Consider using different scans for different market conditions rather than attempting to create universal scans that work in all environments. Build separate scans for trending markets, range-bound markets, high-volatility periods, and earnings seasons, activating the appropriate scans based on current conditions.
For a more conversational approach to trading and market analysis, try Alphio AI's conversational trading interface, which allows you to execute trades and analyze markets through natural chat interactions.
Conclusion
Stock scanners are indispensable tools for modern traders, providing the computational power to monitor thousands of securities simultaneously and identify opportunities that would be impossible to find through manual analysis. Whether you're a day trader seeking intraday momentum plays, a swing trader looking for multi-day setups, or a long-term investor researching fundamental opportunities, scanners can dramatically enhance your market coverage and trading efficiency.
Success with stock scanners requires understanding their capabilities and limitations. Scanners excel at discovery, surfacing stocks that meet your specified criteria in real-time. However, they don't replace the need for analytical judgment, risk management, and strategic thinking. The most successful scanner users treat these tools as research assistants that identify candidates for further analysis, not as signal generators that eliminate the need for trading decisions.
As you develop your scanning skills, remember that simplicity often outperforms complexity. Start with basic scans focused on core parameters like price movement, volume, and liquidity. Master the interpretation of these simple scans before adding additional criteria. This gradual approach builds your understanding of how scanning works while generating actionable opportunities from day one.
The integration of artificial intelligence and machine learning into scanning platforms represents the next frontier in trading technology. Modern platforms like Alphio AI offer sophisticated automation capabilities that can complement your manual scanning efforts. Consider exploring Alphio AI's copy trading feature to mirror successful trading strategies, or leverage agentic trading to automate aspects of your portfolio management. These AI-powered tools can work alongside your traditional scanning to capture opportunities and manage risk around the clock.
Ultimately, stock scanners are force multipliers for your trading knowledge and discipline. They don't create profitable traders, but they do enable skilled traders to operate more efficiently and capture more opportunities. Invest the time to learn your scanning platform thoroughly, develop systematic workflows for processing scan results, and continuously refine your criteria based on performance feedback. With patience and practice, stock scanners become powerful allies in your pursuit of trading success.
FAQs
What is the difference between a stock scanner and a stock screener?
A stock scanner monitors markets in real-time during trading hours, alerting you to price movements and volume spikes as they happen. A stock screener works with end-of-day historical data, allowing you to filter stocks based on fundamental and technical criteria for research purposes. Scanners are essential for active traders who need immediate alerts, while screeners are better suited for long-term investors conducting research.
How much do stock scanners typically cost?
Stock scanner pricing varies widely depending on features and data quality. Basic scanners with delayed data may be free or cost $20-50 monthly. Real-time scanners with professional-grade data feeds typically range from $100-300 per month. Premium platforms with advanced features, AI integration, and comprehensive news feeds can cost $500+ monthly. Many platforms offer free trials allowing you to evaluate before committing.
What are the most important parameters to include in a stock scan?
The most essential scanning parameters include price range (to match your account size), volume thresholds (to ensure liquidity), and percentage change (to identify momentum). For most traders, a basic scan looking for stocks up or down 5%+ on at least 1.5x average daily volume provides a solid foundation. Additional parameters should be added gradually based on your specific strategy and market experience.
Can stock scanners guarantee profitable trades?
No, stock scanners cannot guarantee profitable trades. Scanners are discovery tools that identify stocks meeting specific criteria, but they don't assess trade quality, risk/reward ratios, or market context. Profitable trading requires additional analysis of chart patterns, news catalysts, sector trends, and risk management. Treat scanner alerts as candidates for further research rather than automatic trading signals.
How do I avoid getting too many scanner alerts?
To reduce alert overload, use multi-condition scans that require stocks to meet several criteria simultaneously rather than single-parameter scans. Increase your percentage change and volume thresholds to focus on more significant moves. Consider time-based filtering to focus on specific trading sessions. Most importantly, remember that receiving fewer, higher-quality alerts leads to better trading decisions than processing dozens of marginal signals.